. 2016 Apr 20;5:e10912. doi: 10.7554/eLife.10912

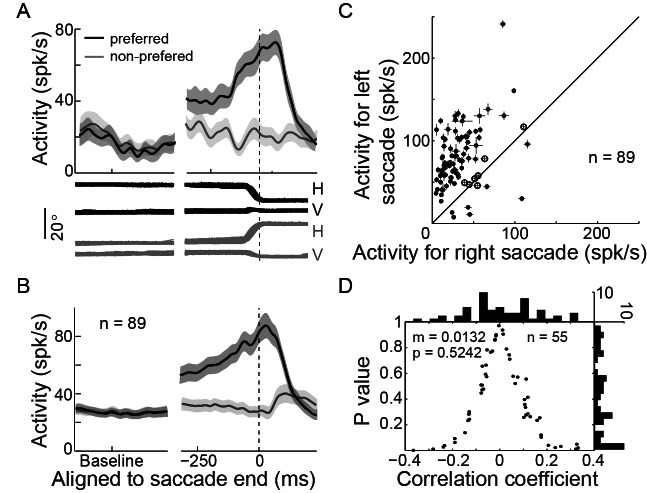
Figure 2. PPS neurons represent the intended end-position of saccades.

(A) The activity of an example PPS neuron in the SCS task. Averaged spike density with the 95% confidence interval (shaded area) in the preferred (black) and null direction (grey) are shown in the upper panel, whereas the horizontal and vertical eye traces are shown in the lower panel. (B) The averaged population activity of 89 PPS neurons (69 neurons from monkey B, 20 neurons from monkey DT). (C) Comparison of each neuron’s activity between trials that saccades directed to the left or right target. Symbols represent the activity of single neurons. The horizontal and vertical bars represent the standard error of the mean (SEM) of pre-saccadic activity (-200~0 ms from saccade start). The filled dots denote that the activity is significantly different between left and right saccades (p<0.05, Wilcoxon test). (D) The correlation between perisaccadic activities (-150~100 ms after saccade end) of single PPS neurons (n = 55) and the end-position of the horizontal saccades. Each dot represents the correlation coefficient value of a single neuron. The histograms in horizontal and vertical axis represent the distribution of correlation coefficient and p value, respectively. (m: mean, p: p value, n: number of neurons).

DOI: http://dx.doi.org/10.7554/eLife.10912.003

Figure 2.

Figure 2—figure supplement 1. Correlation between single PPS neuron’s pre-saccadic and post-saccadic activity.
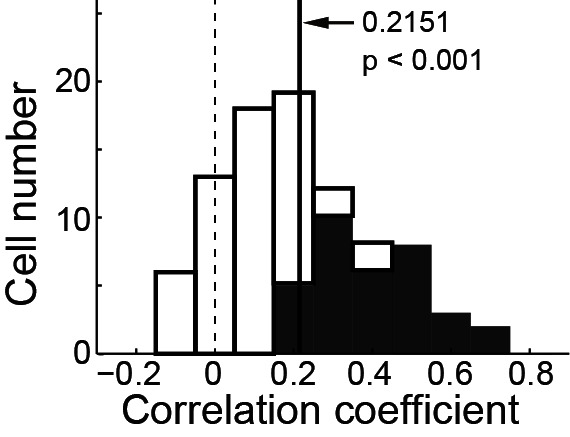
Figure 2—figure supplement 1.

The filled bars indicate a significant correlation (p<0.05, t-test). The solid vertical line represents the mean value of the correlation coefficient. Data show a significant positive correlation in population level (r = 0.2151, p<0.001, two tailed t-test).
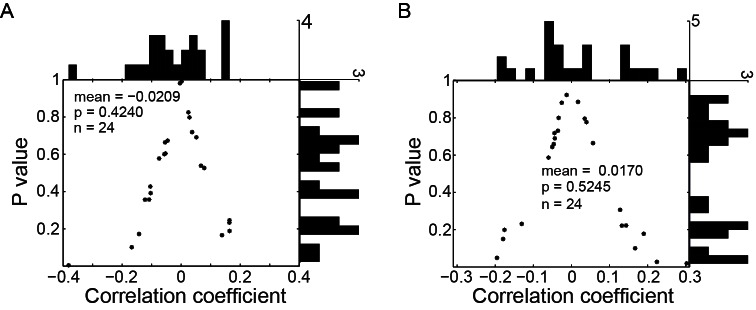
Figure 2—figure supplement 2. Correlation between the single PPS neuron’s perisaccadic activity and the end-position of saccade when monkey made oblique saccades.

Figure 2—figure supplement 2.

(A) The correlation between perisaccadic activity (-150~100 ms after saccade end) of single PPS neuron (n = 24) and horizontal post-saccadic eye position. Each dot represents the value of correlation coefficient analysis of a single neuron. (B) The correlation between perisaccadic activity of single PPS neuron (n = 24) with vertical post-saccadic eye position. In panel (A) and (B), the horizontal and vertical histogram represents the distribution of the value of correlation coefficient and p value, respectively.
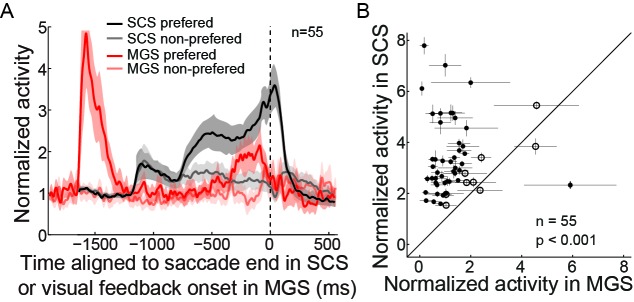
Figure 2—figure supplement 3. The post-saccadic activity of PPS neurons is not evoked by foveal stimulation.

Figure 2—figure supplement 3.

(A) The averaged activity of the PPS neurons is aligned at saccade end in the SCS and at visual feedback onset in the MGS. The shaded area represents the 95% confidence interval. The first visual peak in MGS was evoked by peripheral visual target. The same PPS neurons did not respond to the foveal stimulation in MGS. (B) The comparison of a single neuron’s post-saccadic activity in SCS and foveal stimulation in MGS. Each symbol represents the activity of a neuron. The horizontal and vertical bars represent the standard error of the mean (SEM) of activity. The filled dots denote that the activity is significantly different between two tasks (p<0.05, Wilcoxon test).
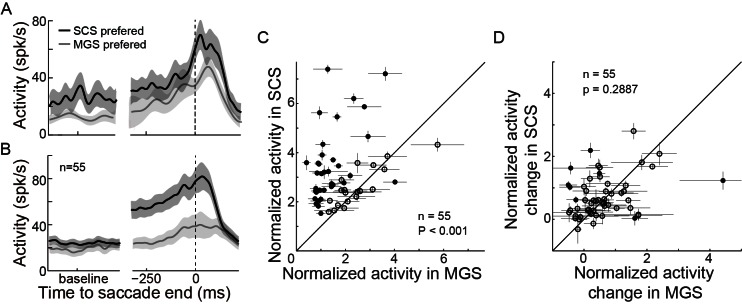
Figure 2—figure supplement 4. PPS neurons show a similar firing pattern but different rate between tasks.

Figure 2—figure supplement 4.

(A) An example neuron’s activity in SCS and MGS tasks. Activity was aligned at saccade end (vertical dashed line). (B) The population activity of 55 PPS neurons. The shaded areas represent the 95% confidence interval. (C) Comparisons of perisaccadic activities (150 ms before to 100 ms after saccade completion) between the SCS and MGS tasks. Most neurons show greater perisaccadic activity in SCS task than that in MGS task (filled symbols, p<0.05, Wilcoxon test). (D) Comparison of relative change of perisaccadic activity between the SCS and MGS tasks. For most neurons, the relative change of perisaccadic activity is similar between two tasks (p>0.05, Wilcoxon test; p=0.2887, in population level, paired t-test).