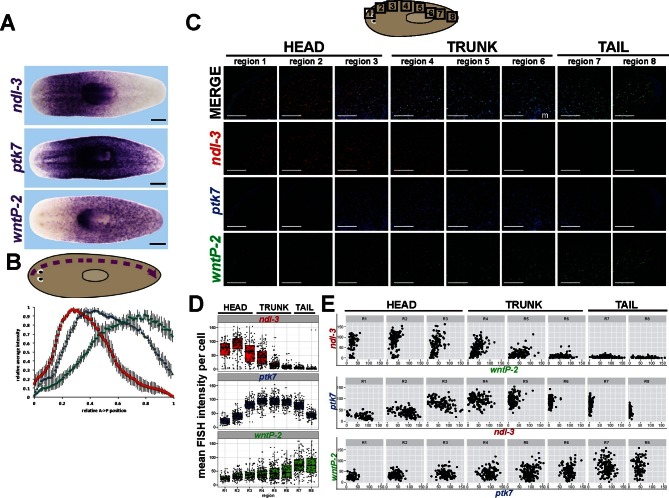
Figure 4. ndl-3, ptk7, and wntP-2 are expressed in a graded fashion in domains along the anteroposterior axis.
(A) In situ hybridizations showing body-wide graded expression of ptk7 centered in the trunk, wntP-2 expression in a gradient from the posterior and ndl-3 expression in a graded fashion from the anterior. (B) Quantitation of colorimetric in situ hybridization staining across the body axis. 4–6 planarians stained as in (A) were imaged on a dissecting microscope, the images were inverted and then analyzed for position-specific staining intensity along a lateral domain depicted in the diagram (dotted line with arrow showing directionality). To compare animals of different lengths, position was normalized to length of this domain and signal intensity was normalized such that the minimum and maximum values across each animal were 0 and 1, respectively, and average intensity at each region was determined for animals stained with each probe treatment computed followed by obtaining average intensity, with bars showing standard deviations. (C) Triple FISH showing expression of ndl-3 (red), ptk7 (blue), and wntP-2 (green) mRNA. Panels are maximum projections from a stack of seven 1-micron thick confocal images taken at 40x along the body axis at the regions represented in the cartoon, then adjusted for brightness and contrast uniformly for each channel across the image series. m, mouth. Bars, 100 microns. (D–E) Quantification of FISH signal intensity for cells identified in images shown in (C). 3-color images were segmented by merging all three channels to define a set of cells in each region with wntP-2, ndl-3 and/or ptk7 expression and this mask used to measure mean FISH signal intensity for each cell. (D) Scatter and box plots showing expression of ndl-3 highest in the anterior, expression of ptk7 highest in the trunk and tail, and highest wntP-2 expression in the posterior. (E) Plots comparing pairwise FISH signal intensity between the indicated genes across eight body axis regions (R1-R8) as in (C). Note the existence of cells expressing both ndl-3 and wntP-2 (R3-R5), ptk7 and ndl-3 (R3-R4), and wntP-2 and ptk7 (R5-R7). Bars, 100 (C) or 200 (A) microns.


