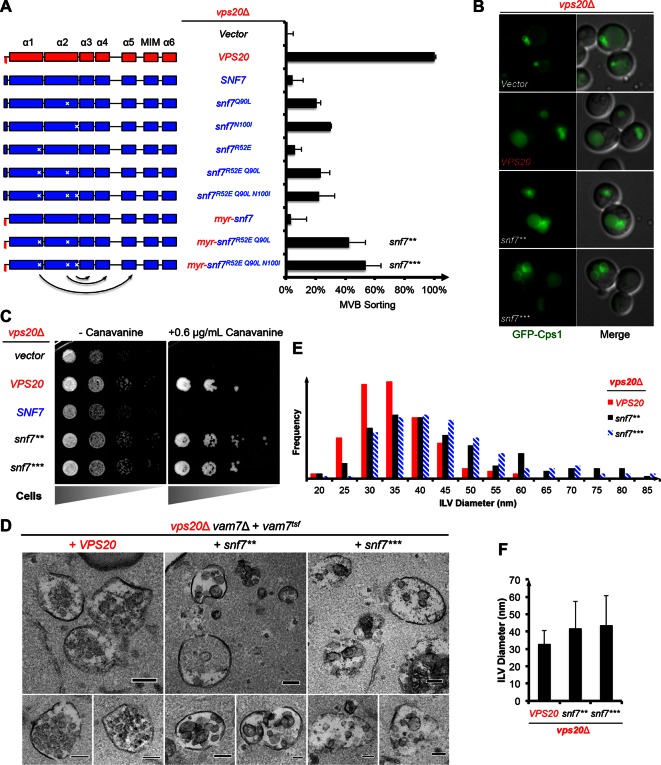
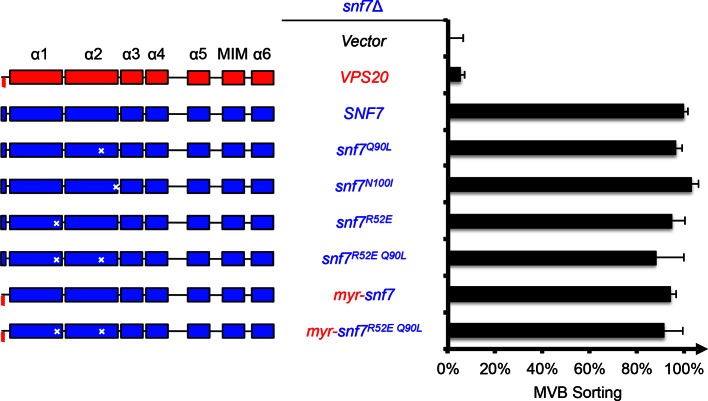
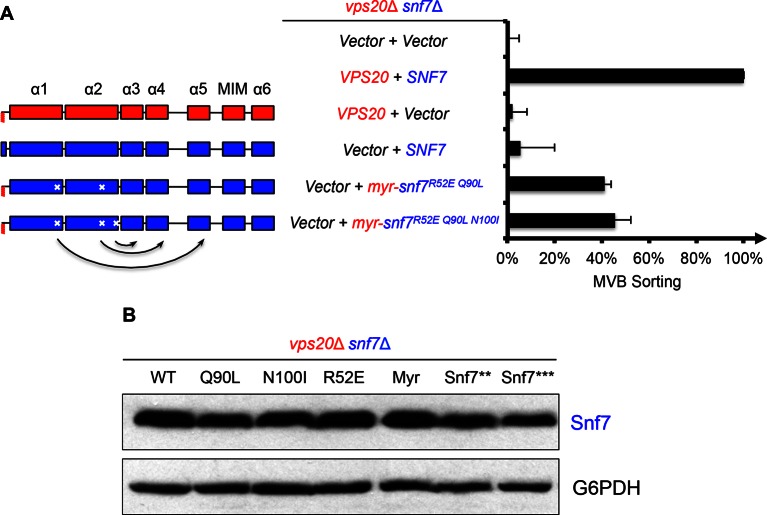
Figure 2. Auto-activated Snf7 functionally bypasses Vps20.
(A) Domain organization of Snf7 mutants (left) and quantitative MVB sorting data (right) for vps20Δ yeast exogenously expressing empty vector, VPS20, SNF7, snf7Q90L, snf7N100I, snf7R52E, snf7R52E Q90L, snf7R52E Q90L N100I, myr-snf7, myr-snf7R52E Q90L, and myr-snf7R52E Q90L N100I. Error bars represent standard deviations from 3–5 independent experiments. The data of myr-snf7 (vps201-5-snf711-240) and SNF7 were re-plotted from Figure 1A for comparsion. Mutants myr-snf7R52E Q90L and myr-snf7R52E Q90L N100I are referred to snf7** and snf7***, respectively. (B) Representative images of vps20Δ yeast exogenously expressing GFP-CPS1 with VPS20, snf7**, and snf7***. GFP images (left) and composite images of GFP and DIC (right). (C) Canavanine sensitivity assay for vps20Δ yeast exogenously expressing empty vector, VPS20, SNF7, snf7**, and snf7***. (D) Representative TEM images of ILV-containing MVBs from vps20Δ vam7Δ yeast exogenously expressing vam7tsf, with VPS20, snf7**, and snf7***. Scale bars 100 nm. (E–F) Quantitation of ILV (N=150 ILV summed per sample) outer diameter from (D) in frequency distributions (E), and averaged measurements (F). Error bars represent standard deviations.


