
Figure 2.
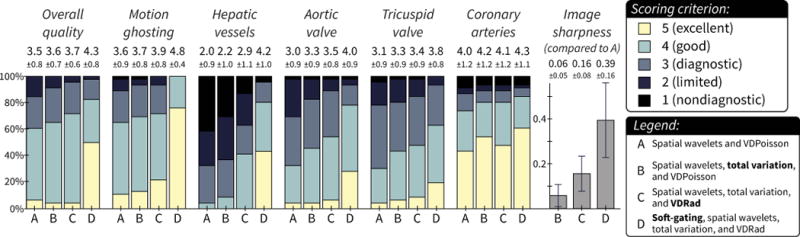
Image assessments with relative image sharpness (computed using gradient entropy metric). See supplementary material for specific scoring criteria for each feature. Each bar represents the percentage of cases with the same score from both readers. The mean ± standard deviation is denoted above each bar. The majority of cases had diagnostic quality with each reconstruction, but method D had significantly improved scores for most features. A larger improvement was observed for features sensitive to respiratory motion (motion ghosting and hepatic vessels). The relative image sharpness compared to method A had a similar progression: method D had the most significant difference in improved scores.