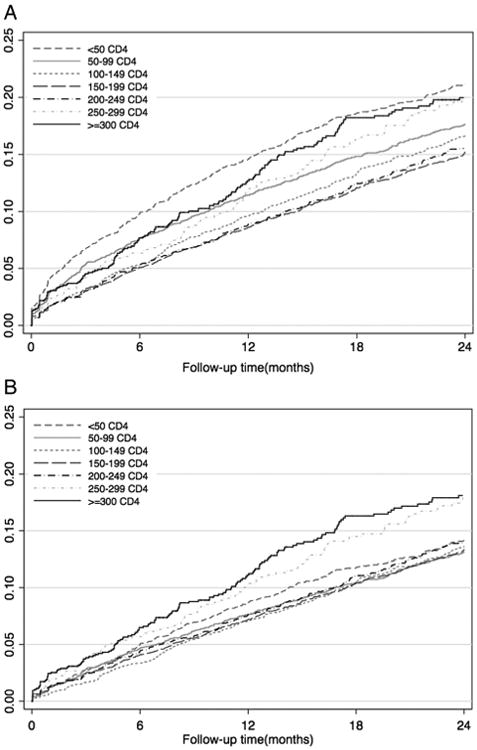
Figure 1.

Kaplan-Meier plots showing observed and corrected 24 months loss to follow-up (LTFU) by CD4 count at ART initiation. (A) Observed LTFU by CD4 count at antiretroviral therapy (ART) initiation 0–24 months follow-up. (B) Corrected LTFU by CD4 count at ART initiation 0–24 months follow-up.
