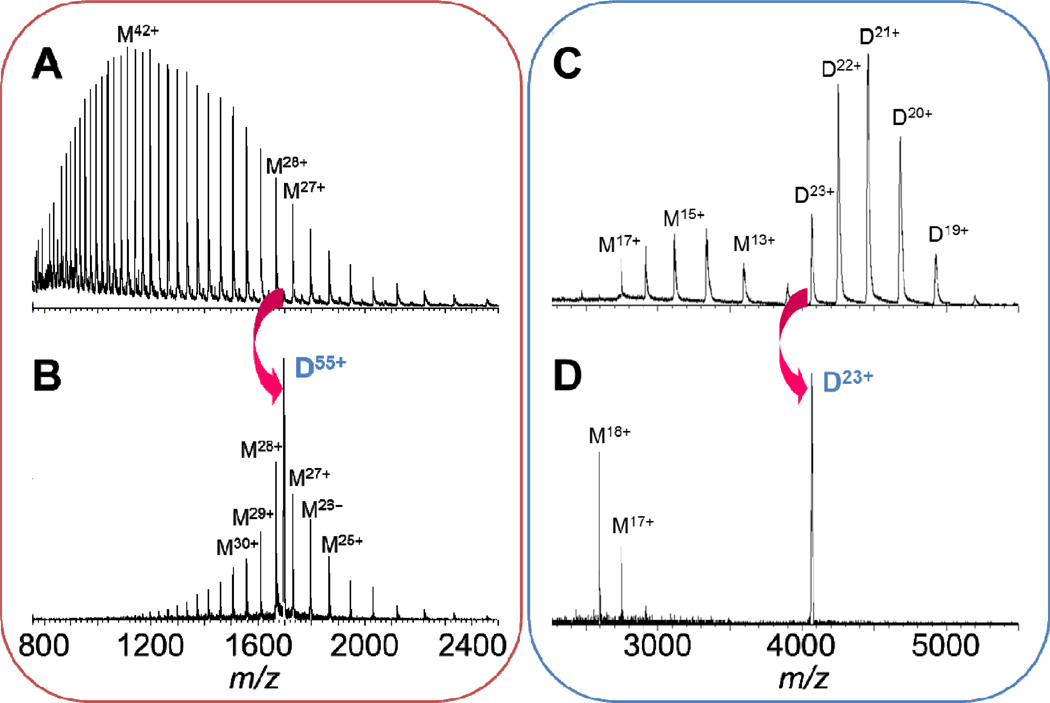
Figure 1.
ESI mass spectra of yeast enolase (46.7 kDa monomer; 93.5 kDa dimer) acquired with a quadrupole time-of-flight instrument. (A) Mass spectrum of enolase in 1:1 H2O/acetonitrile, 5% acetic acid (pH 2.5) and (B) CID mass spectrum of the nonspecific 55+ charged dimer (D, dimer), yielding a symmetric charge distribution of monomers (M, monomer). (C) Mass spectrum of enolase in 10 mM ammonium acetate and (D) CID mass spectrum of the specific 23+ charged dimer complex, distributing charge asymmetrically between monomers.

