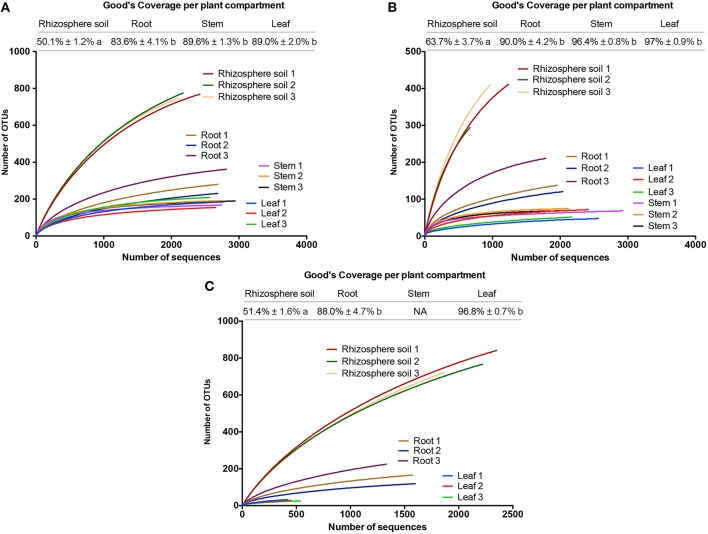
Figure 2.
Good's coverage estimates and rarefaction curves of the different replicates from each plant compartment (rhizosphere soil, root, stem, and leaf) for each primer pair including (A) 799F-1391R, (B) 799F-1193R, and (C) 341F-783Rabc. Good's coverage estimates were calculated in mothur based on 10,000 iterations. Differences at the 95% significance level between the plant compartments are indicated with lower case letters (P < 0.05). Rarefaction curves were assembled showing the number of observed OTUs, defined at a 97% sequence similarity cut-off, relative to the total number of identified bacterial rDNA sequences. To calculate the community estimators, samples were rarified to 417 reads. NA = Not available due to low retrieval of bacterial rDNA reads.

