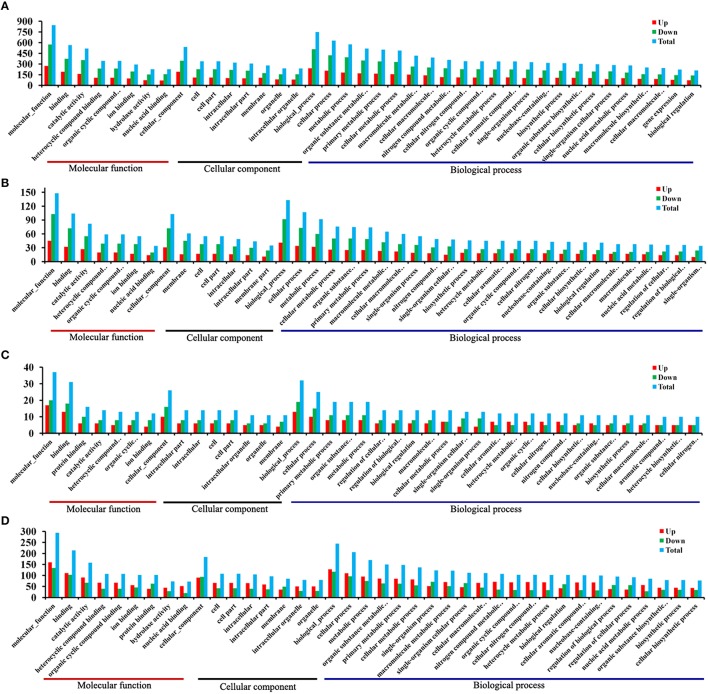
Figure 4.
DEGs GO cluster distribution. DEGs were classified into three main categories: biological process, cellular component and molecular function. Shown are the identified functions and the corresponding numbers of DEGs for each GO category. (A) T1/T0-T DEGs GO cluster distribution. (B) T6/T0-T DEGs GO cluster distribution. (C) T1/T0-C DEGs GO cluster distribution. (D) T6/T0-C DEGs GO cluster distribution. The y-axis indicates the number of genes in a specific category. X-axis indicates different GO terms. Top 40 enriched GO terms are listed.

