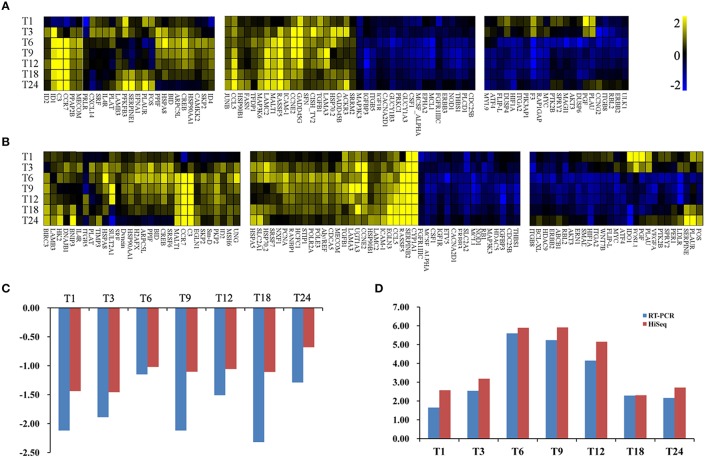
Figure 7.
Heat maps of the fold changes of immune (A) or disease (B) related genes with significantly changing expression levels across the entire infection course. DEGs have been divided into three parts: the left part indicates genes that are upregulated at most infection times; the middle part indicates genes that are upregulated or downregulated at all infection times; the right part indicates genes that are downregulated at most infection times. The range of expression is represented by a color grade ranging from low (blue) to high (yellow). The x-axis indicates DEGs and y-axis means different samples. (C) Relative abundance of SLC2A2 as determined by RT-PCR and HiSeq analysis. X-axis indicates different samples. Y-axis indicates log2 fold change values. (D) Relative abundance of SERPINB2 as determined by RT-PCR and HiSeq analysis. X-axis indicates different samples. Y-axis indicates log2 fold change values.

