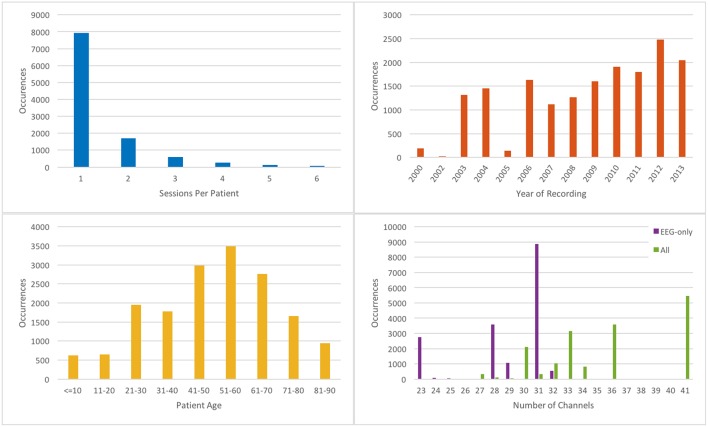
Figure 2.
Metrics describing the TUH-EEG corpus. [Top left] histogram showing number of sessions per patient; [top right] histogram showing number of sessions recorded per calendar year; [bottom left] histogram of patient ages; [bottom right] histogram showing number of EEG-only channels (purple); and total channels (green).

