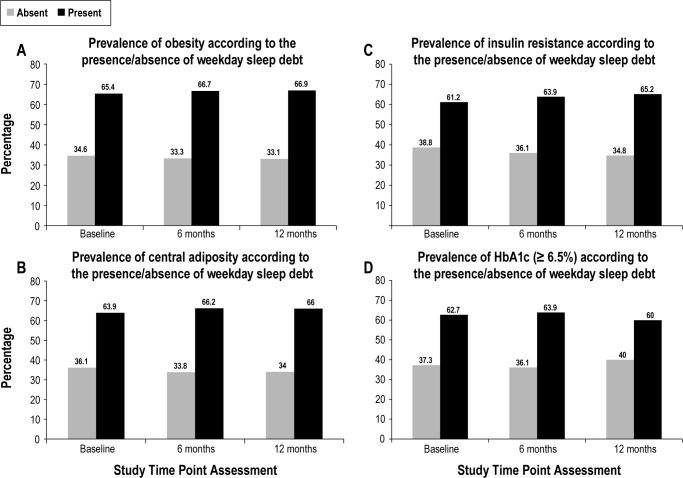
Figure 1. Proportion of individuals with and without sleep debt according to obesity, central adiposity, and insulin resistance at each of the three study time points (baseline, 6 months, and 12 months post-intervention).
(A) percentage of participants with obesity at each assessed time point according to presence/absence of weekday sleep debt at baseline; (B) percentage of participants with excess central adiposity at each assessed time point according to presence/absence of weekday sleep debt at baseline; (C) percentage of participants with insulin resistance at each assessed time.

