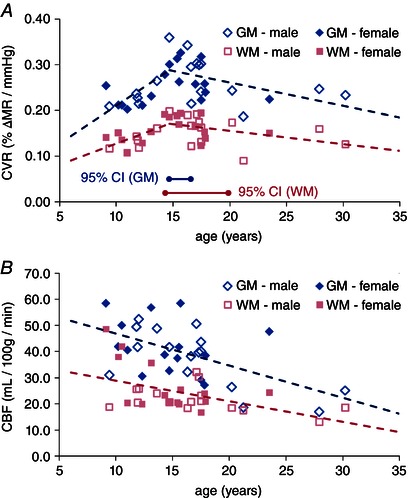
Figure 2. Plots of CVR (A) and CBF (B) with age .

Each data point represents values averaged over GM (diamonds) and WM (squares) for each subject, where an open symbol indicates male and filled symbol indicates female. The dashed line shows the best linear fit. For the CVR, a regression break point was computed at 14.7 years with the 95% confidence intervals indicated by horizontal lines along the bottom of the graph. No break point was detected for CBF.
