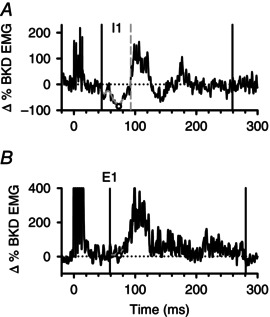
Figure 1. Components of the cutaneomuscular reflex .

A, example of CMR that started with an EMG suppression (I1). The onset of I1 is marked by the first black vertical line and its termination by the dashed vertical grey line as the EMG falls below and returns to the mean pre‐stimulus EMG as marked by the dashed horizontal line. The pre‐stimulus EMG is expressed as a 0% Change (Δ) BKD EMG value. The maximum suppression of EMG activity between reflex onset and before 80 ms (I1max) is marked by the open circle taken from the moving‐window average (solid grey line). The termination of the CMR is marked by the second black vertical line when the EMG response returns to the pre‐stimulus baseline. B, same as in A but for a CMR with no EMG suppression and only an excitatory response with the onset of the early component (E1) marked by the first black vertical line. Here I1max is marked by the lowest point on the moving‐window average between the onset of the reflex and 80 ms. I1 = first inhibitory response; I1max = maximal amount of EMG suppression within I1; E1 = first excitatory response.
