
Figure 3. Representative PSFs in NI participants .
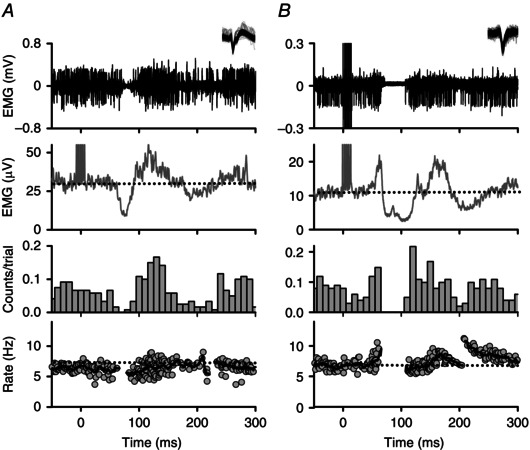
Representative examples of the two main types of PSFs measured in NI participants evoked from cutaneomuscular stimulation (at time = 0 ms). Within the PSF (bottom panel), each dot corresponds to the instantaneous firing rate of a motor unit and the thick black line is a moving‐window average of those rates. Unrectified intramuscular EMG and an inset of the superimposed, isolated motor unit are displayed in the top panel (duration of motor unit waveforms 2–3 ms). A, an initial IPSP is indicated by a pause in firing ∼60 ms following stimulation in the PSF. A pause in firing was noted when there was a break in the PSF and low to no counts in the PSTH (third panel). Dashed horizontal lines indicate mean pre‐stimulus EMG (second panel) and firing rates (bottom panel). B, PSF demonstrating an initial EPSP that preceded the IPSP with increased firing probability and rate near 50 ms following stimulation. Subsequent IPSP is indicated by a pause in firing starting at 60 ms and a resumption of firing near 120 ms with firing rates slightly below baseline. PSF = peri‐stimulus frequencygram; PSTH = peri‐stimulus time histogram.