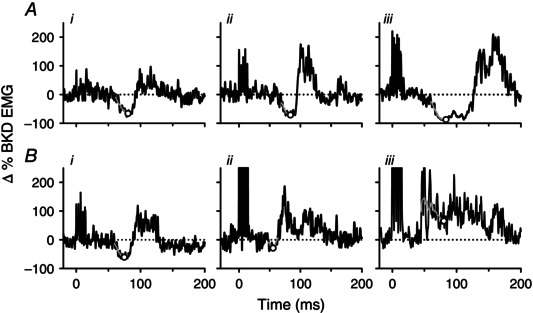
Figure 5. Cutaneomuscular reflexes: surface EMG .

A, black lines represent the averaged surface EMG response (25 trials) to cutaneomuscular stimulation at time = 0 ms for three representative NI participants (i to iii). The grey line represents the moving‐window average from response onset to 80 ms following stimulation with the lowest point on the moving‐window average (I1max) indicated by the open circle. EMG values are normalized to the mean pre‐stimulation EMG (marked by the dotted horizontal line) and expressed as an absolute change (Δ) from that value (mean pre‐stimulation EMG = 0% Δ). B, same as in A but for three representative participants with CP showing progressively lower amounts of EMG suppression (i to ii) and EMG facilitation (iii). I1max = maximal amount of EMG suppression within the first inhibitory response.
