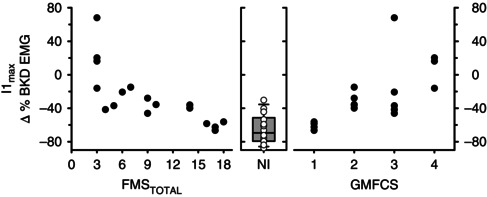
Figure 6. Spinal inhibition and motor function .

The magnitude of I1max is plotted against FMSTOTAL (left panel) and GMFCS (right panel) in the CP group (n = 17). The box plot in the middle panel illustrates the median (thick black line), 25th and 75th percentiles (box bounds), and 95th and 5th percentiles (whiskers) of I1max in the NI group. The scatter of all data points for the NI group (n = 14) is also displayed over the box plot. FMSTOTAL = total Functional Mobility Scale, GFMCS = Gross Motor Functional Classification System, I1max = maximal amount of EMG suppression within the first inhibitory response.
