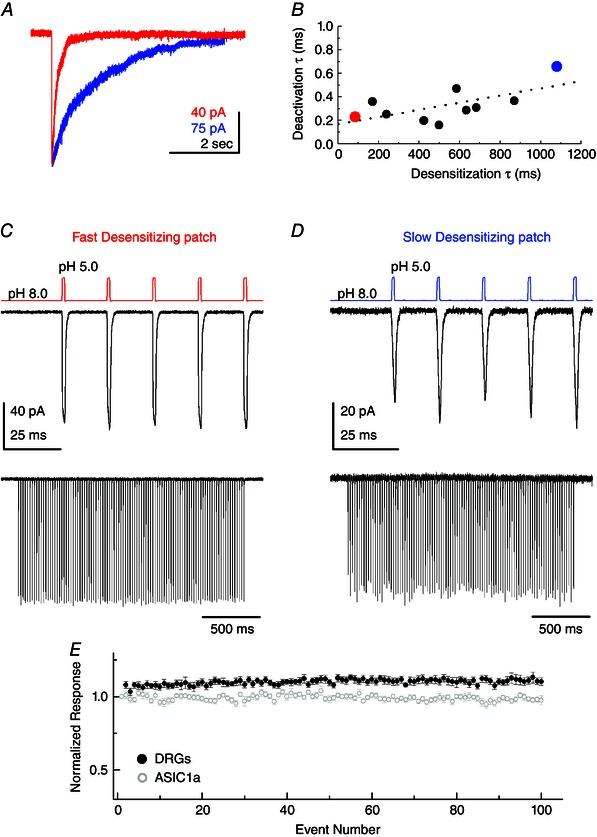
Figure 8. Native ASICs follow high‐frequency stimuli .

A, example responses to a 5 s pH 5.0 jump from patches excised from cultured DRG neurons. Red trace is from the fastest desensitizing patch in the dataset; blue is from the slowest. B, scatter plot of time constants of desensitization and deactivation for each patch from DRG neurons. Red data point is the fastest desensitizing patch from (A); blue data point is the slowest desensitizing patch. Note a wide spread in desensitization kinetics but minimal variance in deactivation. Dotted line is a linear fit to the data. C, responses from the fastest desensitizing patch to 1 ms pH 5.0 jumps at 50 Hz, with the first five responses in the upper panel and the whole 2 s train in the lower panel. D, same plot as in (C) but for the slow desensitizing patch from (A). E, summary of peak responses to 1 ms pH 5.0 jumps at 50 Hz, normalized to first responses, for DRG neurons (black circles) and recombinant ASIC1a (grey circles).
