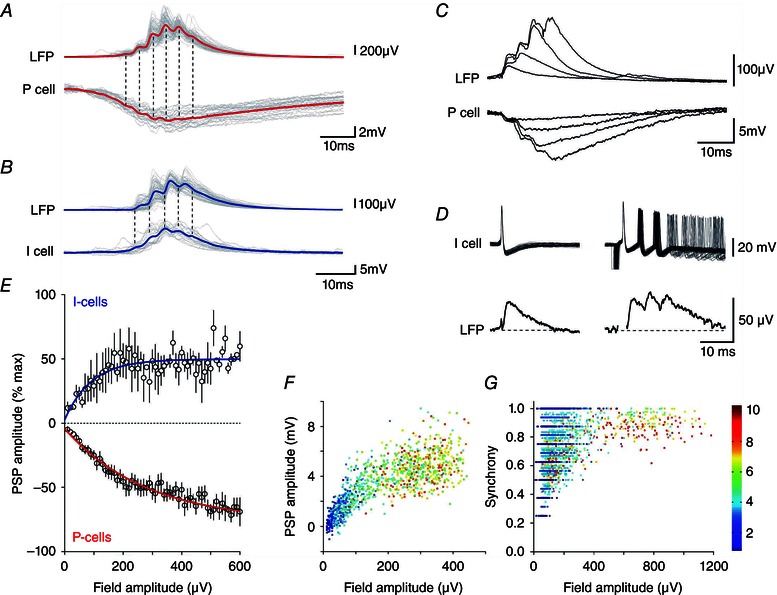
Figure 3. Synaptic events corresponding to SPWs and fIPSPs .

Correlates of SPWs in pyramidal cells (red) (A) and in interneurones (blue) (B) showing the averaged local field and intracellular membrane potential with overlays of 20 traces (grey). C, overlaid field and pyramidal cell membrane potentials for a fIPSP and for SPWs of up to four waves; same records as in (A). D, field potentials (average of 30) induced by single and multiple action potentials in an interneurone. E, peak SPW field amplitude plotted against membrane potential changes in interneurones (blue, n = 4, r 2 = 0.22) and pyramidal cells (red, n = 16, r 2 = 0.96). F, hyperpolarizing change in pyramidal cell membrane potential (n = 16) plotted against the amplitude of fields associated with events from single fIPSPs (blue) to eight to 10 wave SPWs (red). G, spatial coherence for fIPSPs (blue) through to eight to 10 wave SPWs (red) plotted against field potential amplitude (all events from 10 slices).
