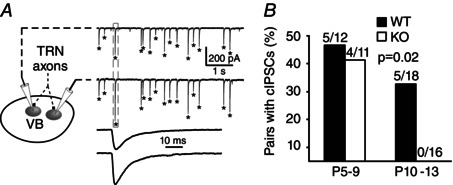
Figure 7. Coincident IPSCs from VB neuron pairs .

A, example of cIPSCs; asterisks indicate IPSCs that are coincident (i.e. peaks within ±1 ms of each other). The box indicates the cIPSCs shown at a fast time scale below. B, prevalence of neuron pairs with statistically significant occurrences of cIPSCs by age range (see Methods).
