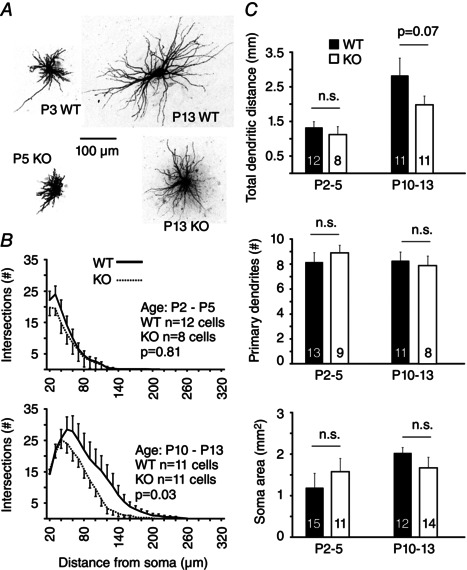
Figure 8. Morphology of VB neurons by Cx36 genotpye and age .

A, photomicrographs of example neurons used for morphological analysis. B, counts of Sholl intersections by distance from the soma (mean ± SEM) by genotype and age group. P values are from a Kolmogorov–Smirnov test. C, morphological characteristics determined from Sholl intersections and 3‐D reconstruction of somata. Numbers of sampled neurons for each group are indicated on the bars. n.s., not significant.
