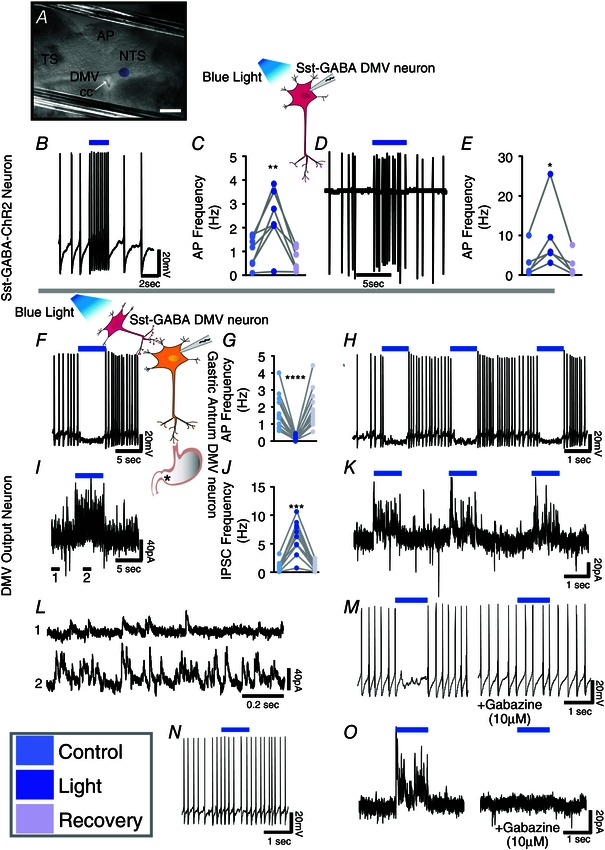
Figure 2. Optogenetic stimulation of Sst‐GABA‐ChR2 neurons in the DMV inhibits vagal output neurons in the nucleus that innervate the gastric‐antrum .

A, photomicrograph showing a recording electrode in the DMV and the extent of the area (purple circle) illuminated by optogenetic stimulation. Scale bar = 200 μm. B, direct light stimulation (blue bar) of a Sst‐GABA‐ChR2 neuron increases its action potential frequency. C, stimulatory effects of light on action potential frequency in Sst‐GABA neurons during current clamp recording (n = 7; **P < 0.01). D and E, a similar increase is seen in action potential frequency of Sst‐GABA neurons recorded in the cell‐attached mode (n = 5; *P < 0.05). F, representative current clamp recording showing light‐induced (blue bar) inhibition of action potential firing in a DMV antrum projection neuron. G, inhibitory effects of Sst‐GABA stimulation on action potential frequency of gastric‐antrum projecting neurons (n = 14/18; ****P < 0.005). H, current clamp recording demonstrating the repeatability of light‐induced inhibition in a DMV antrum projection neuron. I, voltage clamp recording (V H = −30) from the cell in (F) showing that light stimulation (blue bar) is accompanied by an increase in IPSCs. J, light stimulation robustly increases sIPSCs in antrum projecting neurons (n = 11; ***P < 0.001), which is repeatable (K). L, expanded view of regions 1 and 2 in the tracing in (I), showing sIPSCs before (1, top) and during light stimulation of Sst‐GABA neurons (2, bottom). M, the decrease in light‐induced action potentials is prevented by pretreatment with gabazine. N, representative tracing of action potentials in a DMV antrum projection neuron that was unaffected by optogenetic stimulation. O, increase in IPSCs as a result of light stimulation is blocked by gabazine. Blue bar = light with λ of 450–490 nm.
