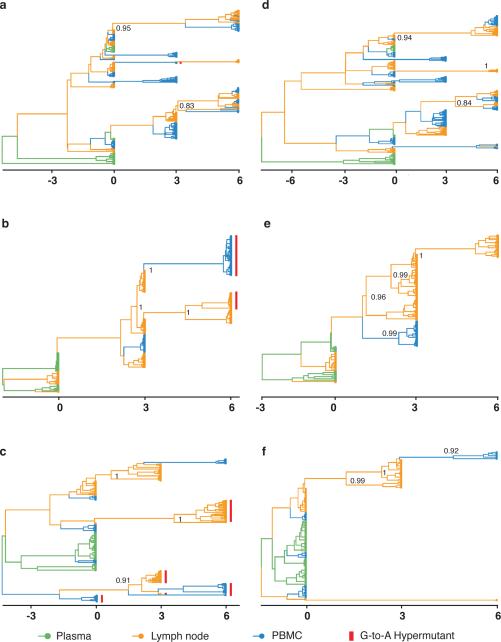
Figure 1. Time-structured phyloanatomic history of haplotypes in lymph nodes and blood.
MCC phylogenetic trees constructed from the complete alignments of the haplotypes from the Gag region of HIV-1 for subjects 1774, 1727 and 1679 with all haplotypes (a, b and c, respectively) and with the haplotypes containing G-to-A hypermutations removed (d, e and f, respectively). Branch colors represent the most probable (modal) anatomic location of their descendent node inferred through Bayesian reconstruction of the ancestral state, along with the posterior probabilities for the location of their parental nodes.

