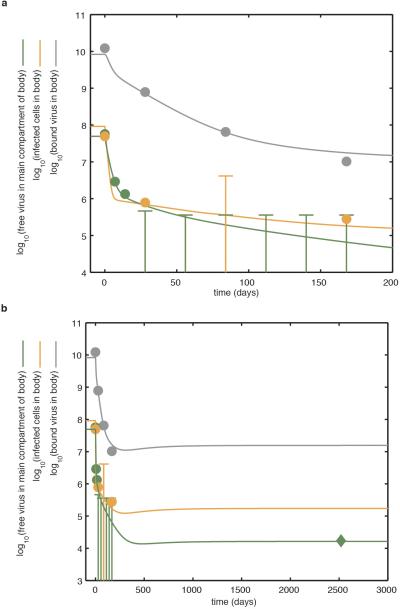
Extended Data Figure 5. Model of replication dynamics and treatment effectiveness in the viral reservoir fitted to the data.
The model is fitted to the total inferred average body counts of free virus particles (green line), infected CD4+ T cells (orange line) and virus bound to the follicular dendritic cell network of B cell follicles (grey line). a, Demonstrates the dynamics over the first 200 days of treatment. Note that early on during antiretroviral therapy, HIV-1 RNA in plasma declines more rapidly than virus bound to the follicular dendritic cell network of B cell follicles. Circles demonstrate average data from the 3 patients discussed in detail in this study and an additional 9 patients presented elsewhere13. Where the average value was indeterminate because of test sensitivity, the data are fitted below the upper limit of the average log10 infectious units. b, Demonstrates the dynamics over a longer period. The model predicts the persistent low-level viral RNA in plasma. The diamond symbol represents data relating to the long-term persistent virus, as measured using quantitative reverse transcription PCR (see Methods). The optimal model fit parameters are presented in Supplementary Table 1.

