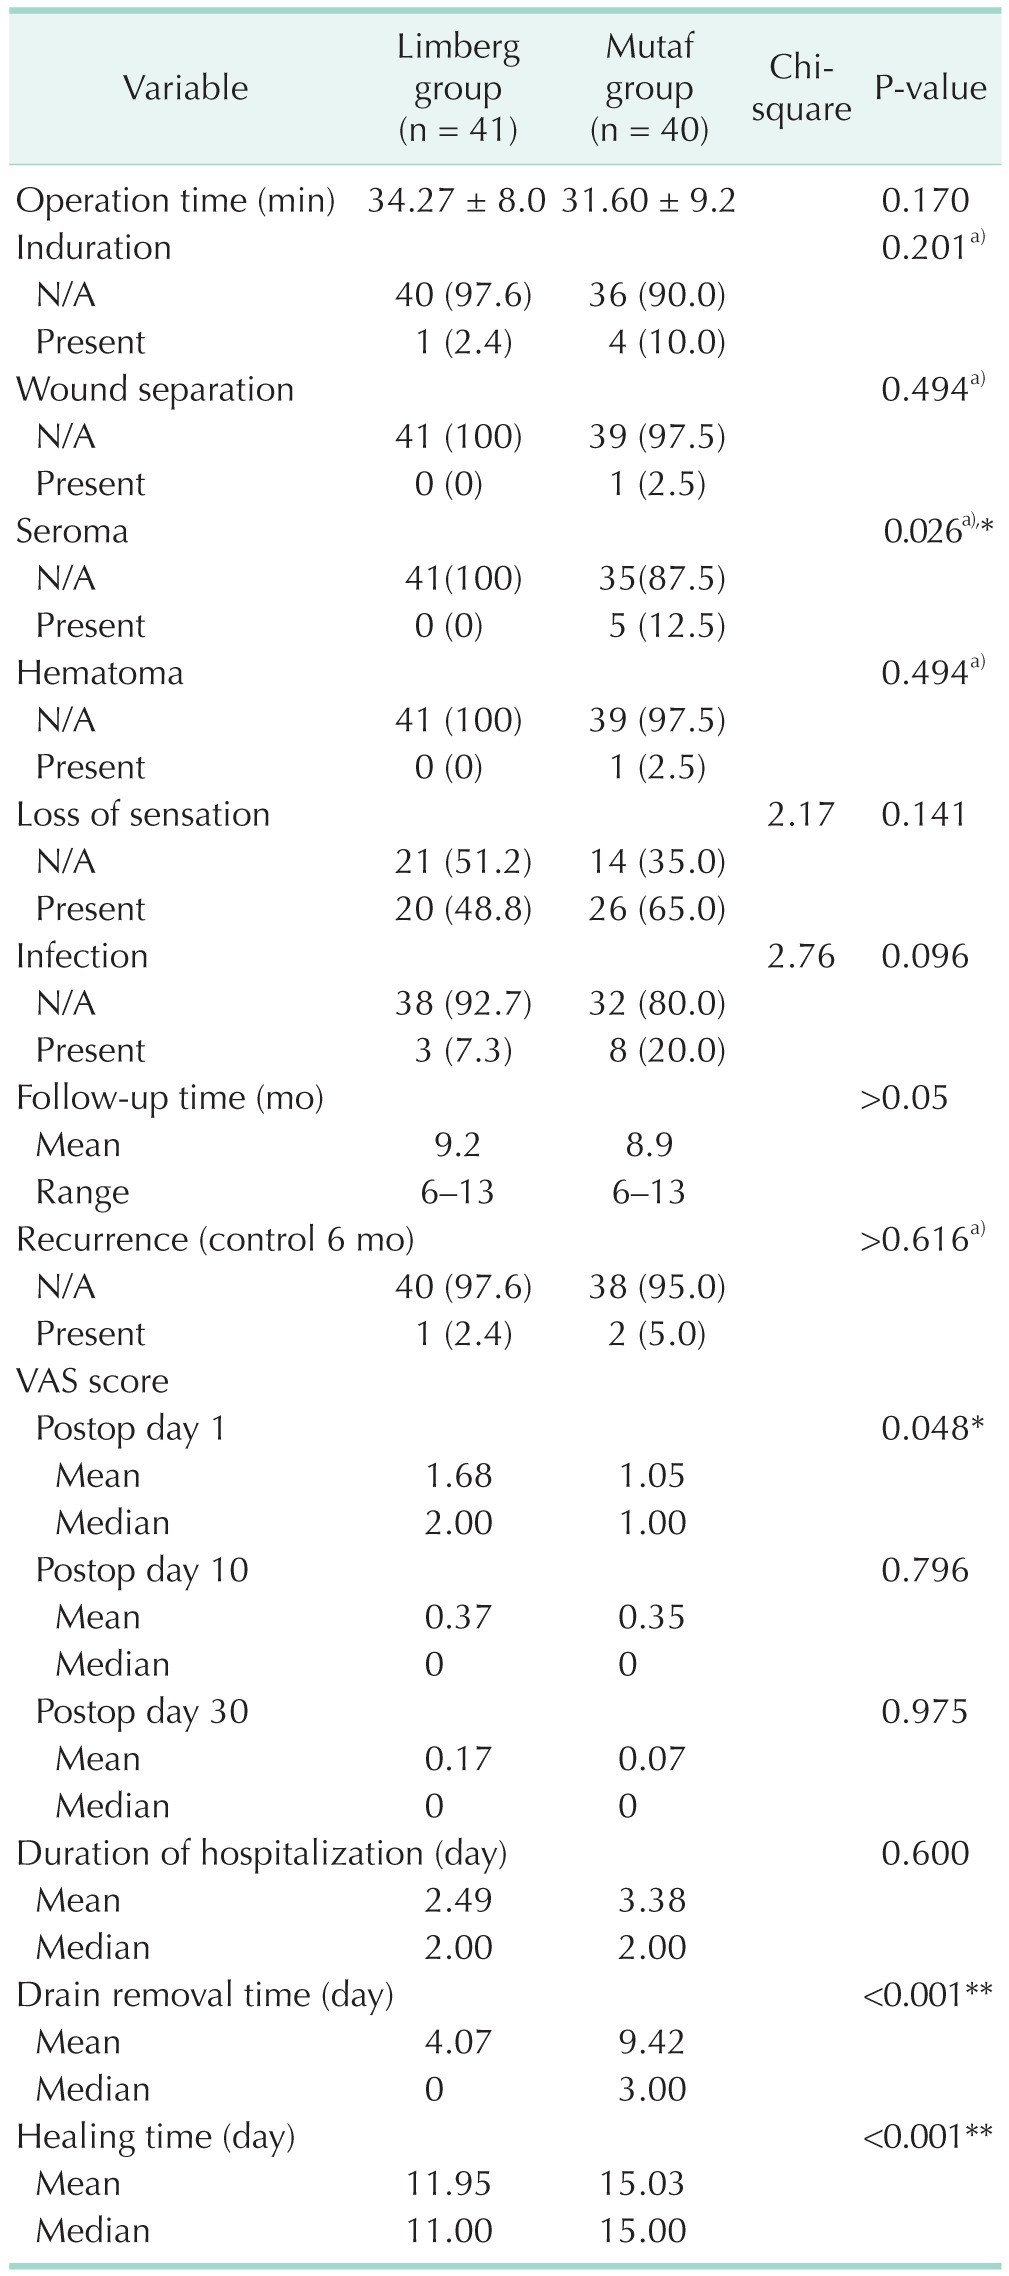
Table 3. Preoperative and postoperative evaluation results.

Values are presented as mean±standard deviation or number (%) unless otherwise indeciated.
N/A, absent; VAS, visual analogue scale.
a)Fisher exact test. *P < 0.05 significant level of importance. **P < 0.01 significant level of importance.
