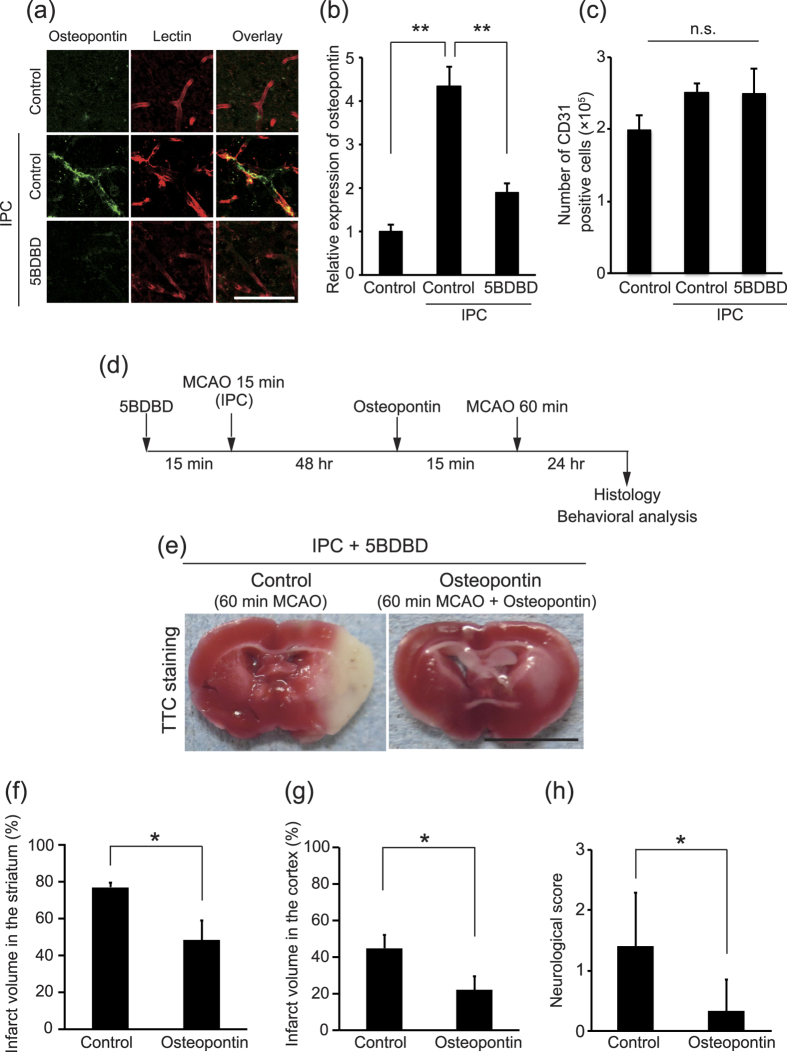
Figure 5. Osteopontin administration attenuates the increase in infarct formation induced by P2X4 receptor inhibition.
(a) Representative images of brain sections labeled for osteopontin (Alexa Fluor 488) and lectin (Dylight 594). Scale bar, 100 μm. (b) IPC upregulated the relative osteopontin expression in lectin-labeled vascular endothelial cells in the brains of mice (p < 0.0001, **p < 0.01, ANOVA with the Tukey-Kramer test). 5BDBD prevented this upregulation (p < 0.0001, **p < 0.01, ANOVA with the Tukey-Kramer test). The data represent the mean ± s.e.m. (n = 3 each). (c) The number of CD31-positive cells did not significantly differ between groups (p = 0.2936, ANOVA with the Tukey-Kramer test). The data represent the mean ± s.e.m. (n = 3 each). (d) Experimental design of this study. IPC (15 min ischemia) was conducted 48 hr before MCAO (60 min ischemia). 5BDBD was intracerebroventricularly administered 15 min before IPC. Recombinant osteopontin or saline was administered 15 min before MCAO. Brain sections were obtained 24 hr after MCAO. (e) Representative images of TTC-stained brain slices. Bar, 5 mm. (f, g) Graphs show the percentage of infarction in the ipsilateral striatum (f) and in the ipsilateral cortex (g). Osteopontin administration attenuated the increased infarct formation induced by P2X4 receptor inhibition (striatum p = 0.0214, cortex p = 0.0259, *p < 0.05, Student’s t-test). The data represent the mean ± s.e.m. (control, n = 5; osteopontin, n = 6). (h) Osteopontin administration attenuated the neurological deficit induced by P2X4 receptor inhibition (p = 0.0174, *p < 0.05, Student’s t-test). The data represent the mean ± s.e.m. (control, n = 5; osteopontin, n = 6).

