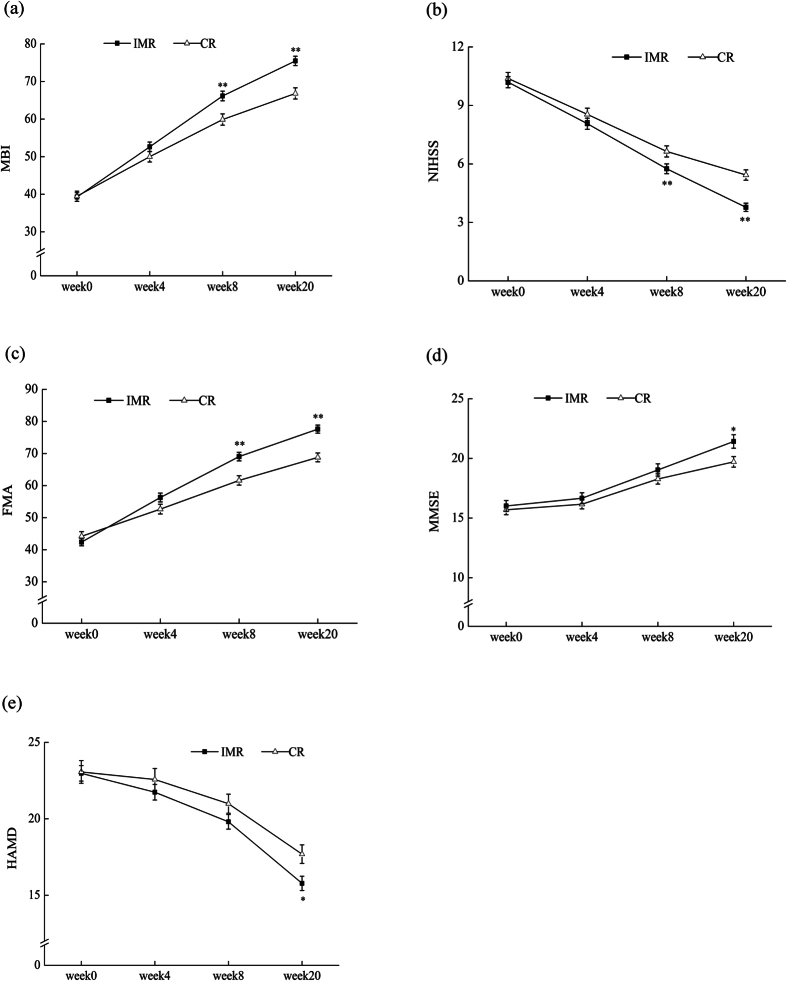
Figure 2. Means of MBI, NIHSS, FMA, MMSE, HAMD at Four Testing Time points.
(a) MBI score for the IMR and CR at four testing time points (mean ± SEM; IMR n = 176, CR n = 172). **P < 0.01, compared to CR group. (b) NIHSS score for the IMR and CR at four time points (mean ± SEM; IMR n = 176, CR n = 172). **P < 0.01, compared to CR group. (c) FMA score for the IMR and CR at four testing time points (mean ± SEM; IMR n = 176, CR n = 172). **P < 0.01, compared to CR group. (d) MMSE score for the IMR and CR at four testing time points (mean ± SEM; IMR n = 62, CR n = 69). *P < 0.05, compared to CR group. (e) HAMD score means for the IMR and CR at four testing time points (mean ± SEM; IMR n = 76, CR n = 77). *P < 0.05, compared to CR group.

