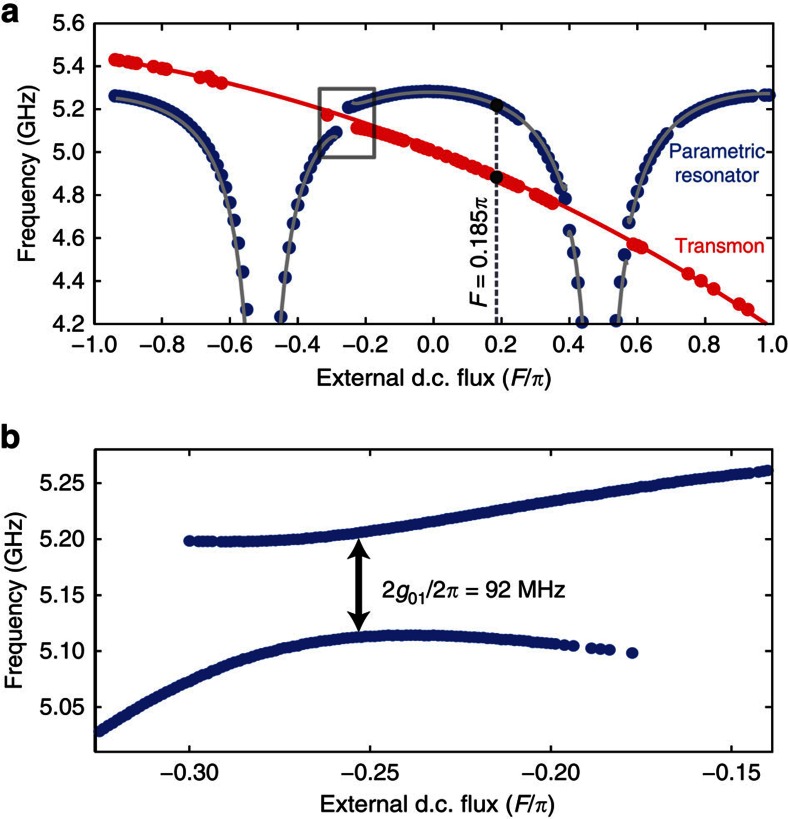
Figure 2. Combined resonator-qubit frequency spectra.
(a) Qubit spectroscopy was used to map out the transmon spectrum (in red), whereas the resonator spectrum (in blue) was extracted using standard reflectometry. The solid red and grey lines are fits. The dashed grey line, at resonator flux bias F=0.185π, indicates the bias point at which we later demonstrate the read-out method. (b) Vacuum Rabi splitting around the flux bias point where the transmon frequency crosses that of the resonator, indicated by the grey box in a. The minimum frequency splitting yields a qubit–resonator coupling g01/2π=46 MHz.

