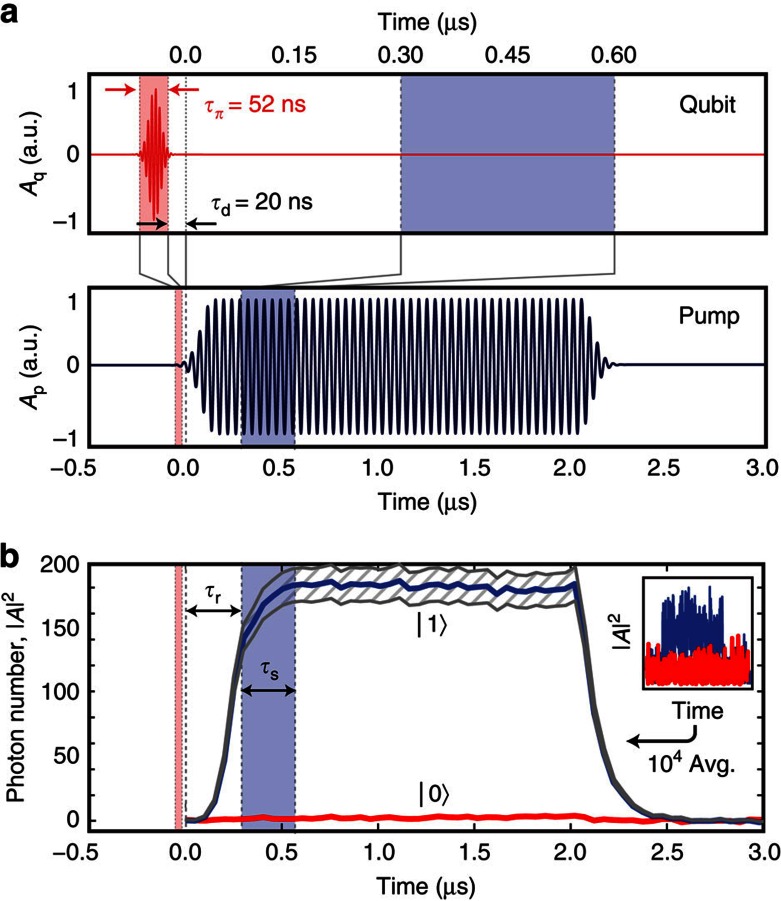
Figure 3. Qubit read-out by the Josephson parametric oscillator.
(a) Pulse sequence: the qubit π-pulse (in red), with Gaussian edges and a plateau of duration  , is followed by a short delay,
  , before the pump is turned on at time t=0. (b) The solid blue and red traces show the inferred photon number, |A|2, in the resonator, with and without a prior π-pulse on the qubit, respectively. Note that the resonator latches, once it has entered into the oscillating state, and remains there even if the qubit relaxes. The traces are the result of 104 averages of the raw data; the inset shows a single instance of the raw data on the same time axis as the main plot. Before the sampling window of width
  , a delay
  is added to avoid recording the transient oscillator response. The hatched region around the average photon number represents our uncertainty, originating from the amplifier gain calibration.

