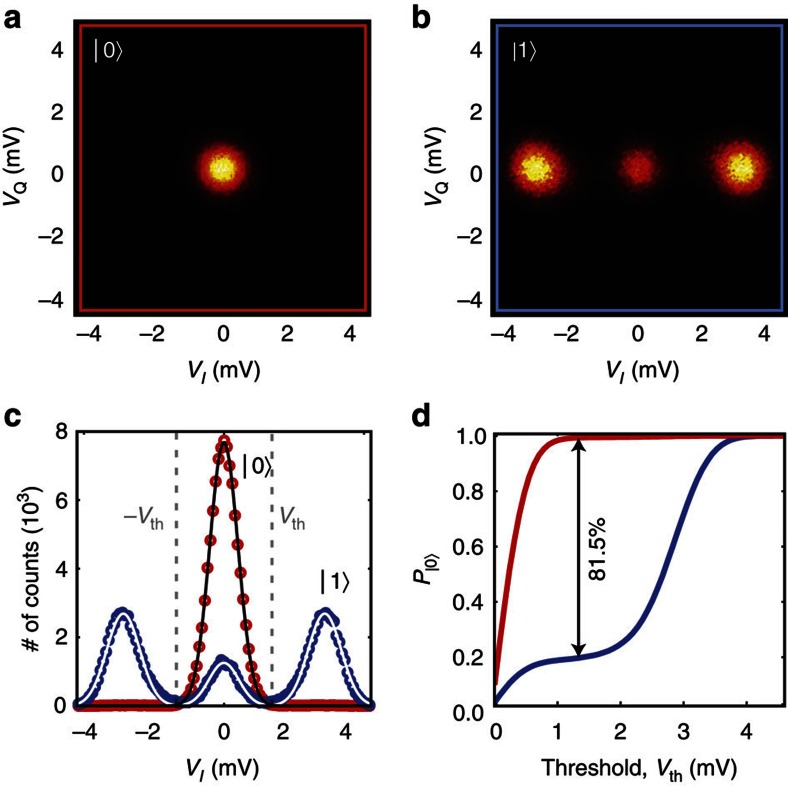
Figure 5. Quadrature voltage histograms of the parametric oscillator output collected after digital sampling.
The pump bias point was δ|0〉/Γ=−5.34,  . In (a), the qubit was in its ground state; in (b), a π-pulse was applied before the read-out pulse. (c) 1D histograms of the in-phase voltage component, VI, from the quadrature histograms in a and b. The black and white solid lines are Gaussian fits, from which we extracted a signal-to-noise ratio of 3.39. (d) Cumulative distribution functions, corresponding to the |0〉 and |1〉 states, obtained by sweeping a threshold voltage, Vth, from the centre of the two histograms (VI=0). The maximum separation between the two S-curves yields a state discrimination of 81.5%.

