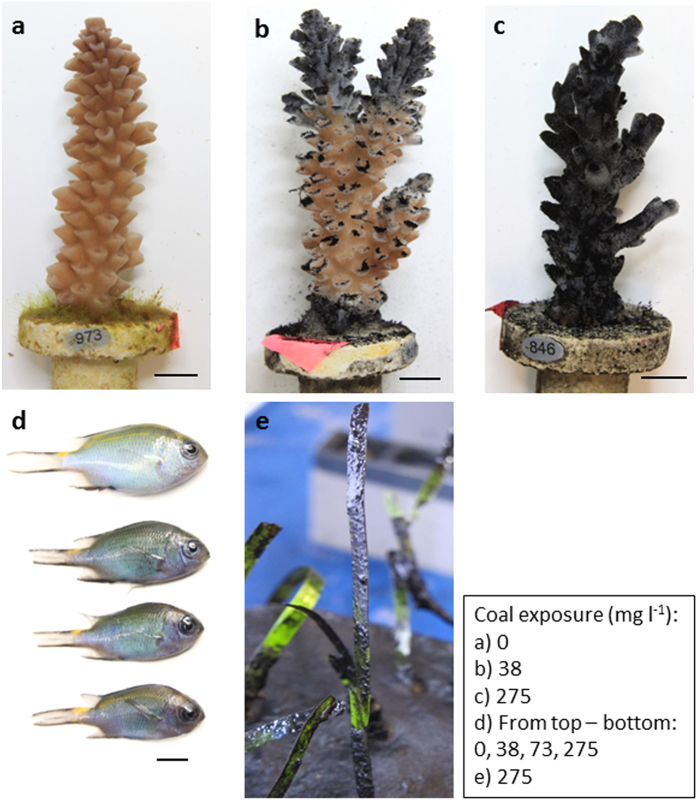
Figure 1. Comparison of three taxa after coal exposure.
Stages of coral health degradation after 14 d exposure to 0 mg coal l−1 (a), 73 mg coal l−1 (b) and 275 mg coal l−1 (c). Mucus strands were used to actively remove settled coal (b) and coal deposition that exceeded removal efforts resulted in nubbin mortality (c). Fish from control vs. coal exposed treatments (0 mg coal l−1–275 mg coal l−1) after 28 d exposure (d). Coal settled onto seagrass leaves and substrate (e). Note: No fish were present in the 202 mg coal l−1 treatment. All scale bars = 5 mm.

