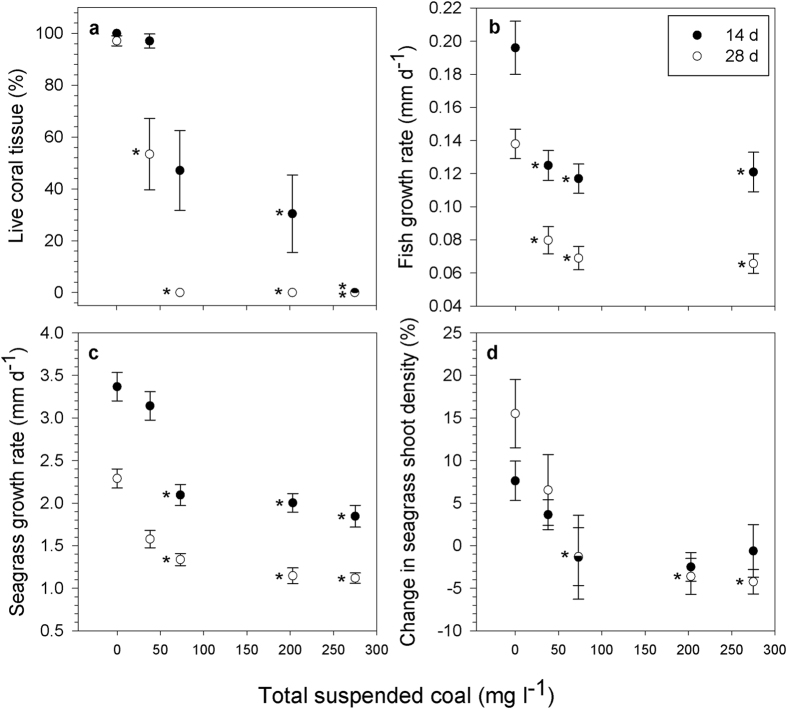
Figure 2. Differences in measures of key demographic rates in relation to coal concentration and exposure duration.
Differences in the mean (±s.e.m.) survival of corals (A. tenuis) (a), growth rates of fish (A. polyacanthus) (b) and seagrass (H. uninervis) (c), and percentage change in seagrass shoot density (d) at 14 d (closed circle) and 28 d (open circle) exposure. Asterisks depict a significant difference (P < 0.05) between the mean coal treatment and control values. Note: mean change in seagrass shoot density (d) is relative to time 0 values at each treatment level in each replicate seagrass pot. Mean values above 0 suggest growth, while values below 0 suggest mortality. No fish were present in the 202 mg coal l−1 treatment.

