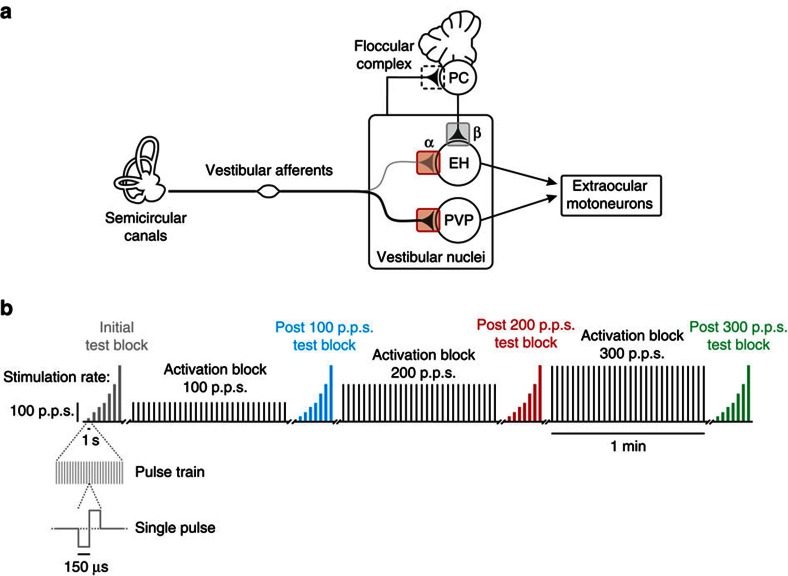
Figure 1. Diagram of VOR circuitry.
(a) Vestibular afferents project to PVP neurons, which in turn send projections to extraocular motoneurons. EH neurons receive direct input from the vestibular nerve and from floccular Purkinje cells, and they project to extraocular motoneurons. (b) Schematic of electrical stimulation protocols. Each rectangle represents a pulse train where the height is the rate and the width is the duration. During test blocks, each pulse train lasted 1 s and rates of 25–300 p.p.s. were used. During activation blocks, 30 pulse trains, each lasting 500 ms, were delivered over the course of 1 min at 100, 200 and 300 p.p.s.

