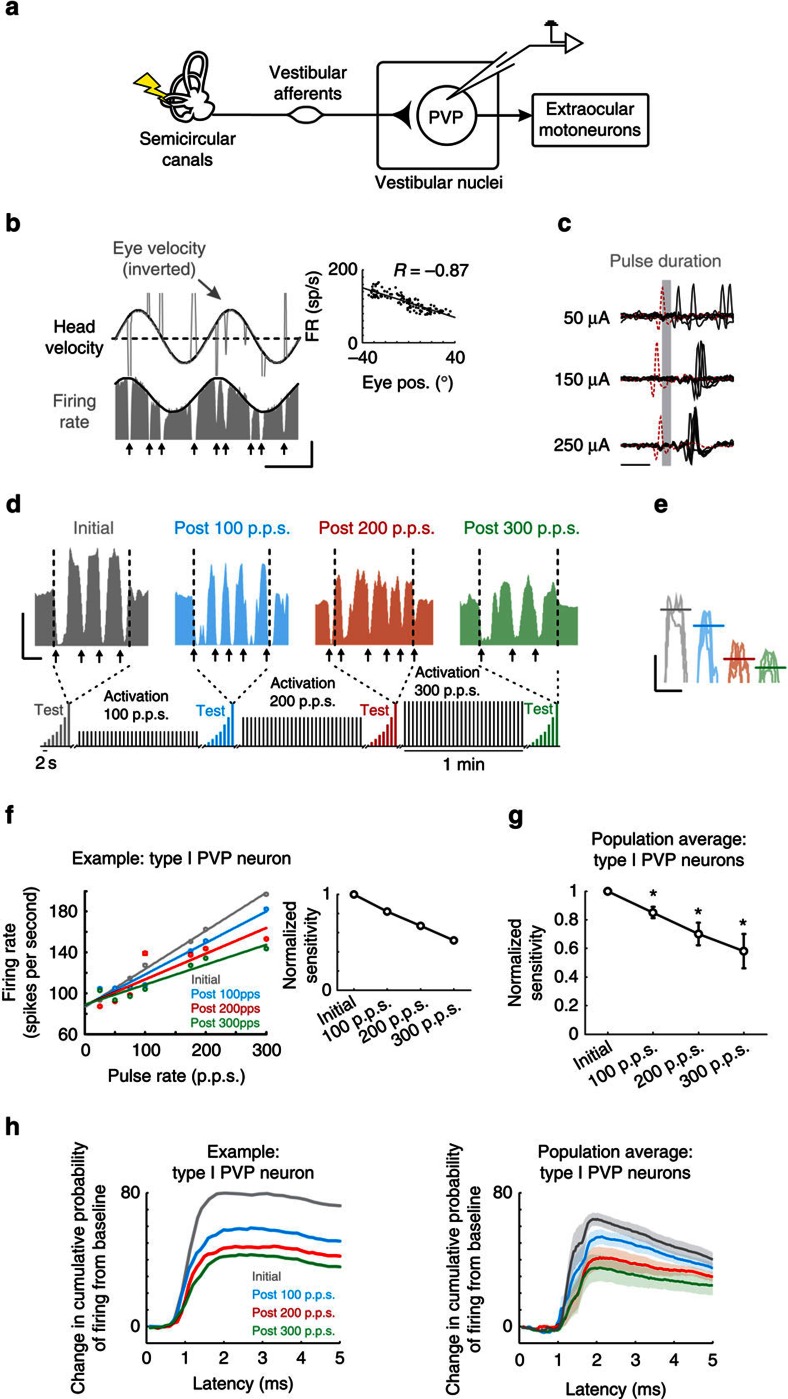
Figure 2. Rapid plasticity within direct VOR pathways.
(a) Diagram of direct VOR circuitry. (b) Firing rate of example type I PVP neuron during VOR. Note eye velocity is inverted and the ipsilateral direction relative to side of recording is upwards. Arrows highlight when saccades occurred. Inset shows example neuron's eye position sensitivity. Calibrations bars, 40 ° per s, 100 spikes per s, 1 s. (c) Same example neuron's response to single pulses of increasing current amplitude. Red traces indicate trials during which the neuron failed to fire an action potential because the pulse occurred during its refractory period. Calibration bar, 1 ms. (d) Firing rate before (grey) and after activation of the vestibular nerve with rates of 100 (blue), 200 (red) and 300 p.p.s. (green) in response to test stimuli delivered at 300 p.p.s. Note that following activation, the response of the neuron decreased. Inset shows schematic of electrical stimulation protocols. Arrows show when saccades occurred. Calibrations bars, 100 spikes per s, 0.25 s (e) Periods of firing rate during the compensatory portion of the eye movement for the example neuron are superimposed to show the decreased response after activation of the vestibular nerve. Calibrations bars, 50 spikes per s, 0.25 s. (f) Plot of firing rate as a function of pulse rate for example neuron before and after activation of the vestibular nerve. Inset shows normalized sensitivity (slope of firing rate versus pulse rate) for example neuron. (g) Population average of normalized sensitivity for type I PVP neurons (n=15). *P<0.05 (Student's t-test). (h) Probability of firing as a function of latency following individual pulses for example neuron (left) and population averages (right) before and after activation of vestibular nerve. Error bars and shaded area represent ±s.e.m.

