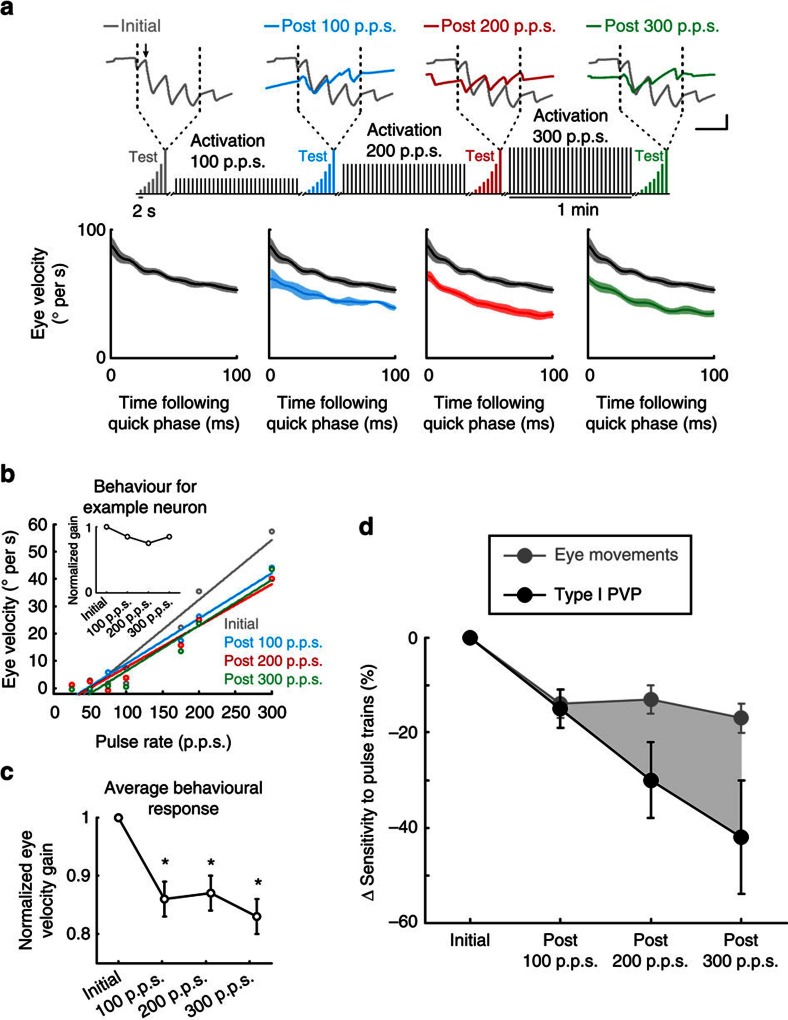
Figure 4. Eye movement responses decrease following activation of the vestibular nerve.
(a) Top panel: eye position traces during test stimuli at 300 p.p.s. before and after activation of the vestibular nerve. Inset shows schematic of electrical stimulation protocols. Arrow highlights example quick phase. Bottom panels: averaged eye velocity over the 100 ms following each saccade that occurred throughout the 1 s of stimulation at 300 p.p.s. Calibrations bars, 10 °, 0.5 s. (b) Average eye velocity (restricted to periods of compensatory VOR) as a function of pulse rate for the corresponding eye movements recorded with the example neuron in Fig. 2. Inset shows normalized gain (slope of eye velocity versus pulse rate). (c) Average normalized gain across all trials (n=61). *P<0.05 (Student's t-test). (d) Comparison between decrease in sensitivity for type I PVP and eye movement responses. Error bars and shaded area represent ±s.e.m.

