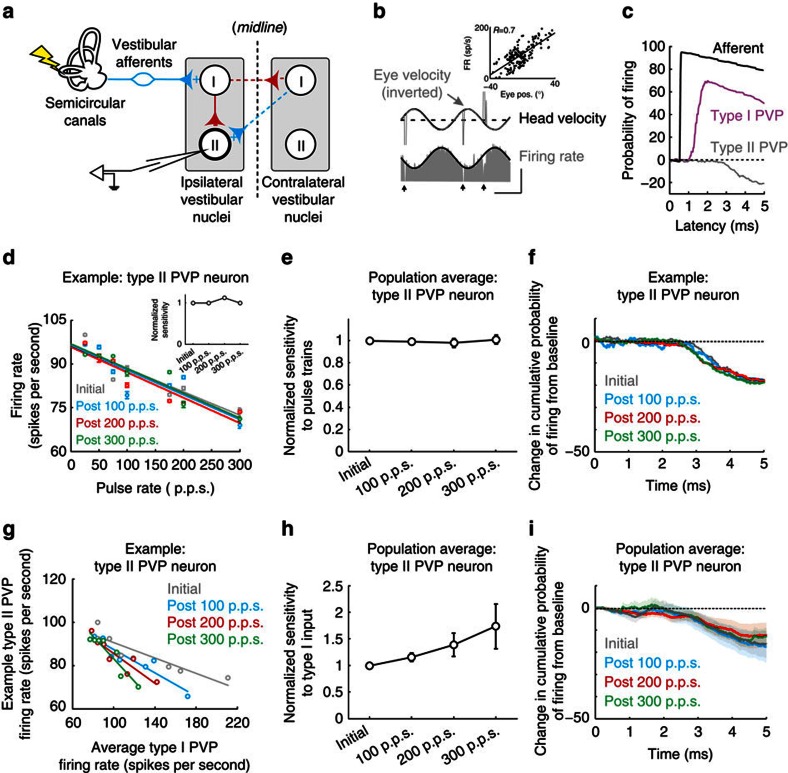
Figure 5. Rapid complementary changes in indirect inhibitory brainstem pathways.
(a) Diagram of local inhibitory pathway within the vestibular nuclei. (b) Firing rate of example type II PVP neuron during VOR. Arrows highlight when saccades occurred. Inset shows example neuron's eye position sensitivity. Calibrations bars, 100 ° per s, 100 spikes per s, 1 s. (c) Probability of firing as a function of latency from onset of individual pulses for vestibular afferent, as well as for type I and II PVP neurons. (d) Plot of firing rate as a function of pulse rate for example neuron before and after activation of the vestibular nerve. Inset shows normalized sensitivity (slope of firing rate versus pulse rate) for example type II PVP neuron. (e) Population average of normalized sensitivity for type II PVP neurons (n=10). (f) Probability of firing as a function of latency following individual pulses for example neuron before and after activation of vestibular nerve. (g) Input–output relationship between type I and type II PVP neurons (that is, type II PVP example neuron firing rate as a function of average type I PVP neuron firing rate) before and after activation of the vestibular nerve. (h) Population average of normalized sensitivity to type I input for type II PVP neurons (n=10). (i) Population averaged probability of firing as a function of latency following individual pulses before and after activation of vestibular nerve. Error bars and shaded area represent ±s.e.m.

