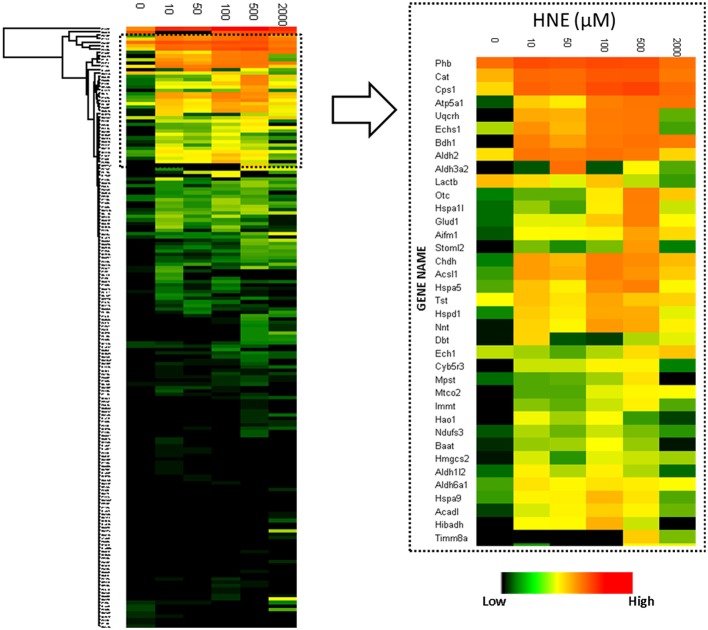
Figure 4.
Heatmap visualization of quantitative values of the 182 proteins enriched at the protein level. Left: heatmap of the 182 proteins identified and quantified over all six HNE exposure groups; Right: Zoomed-in region of the heatmap focusing on the most abundantly detected and identified putative HNE protein adducts. After affinity capture, samples were trypsin-digested and analyzed using LC-MS. Protein quantification was based on the peak intensity of the 3 most intense peptides. A total of 182 proteins were quantified. From top to bottom the 182 identified proteins are listed and each row represents a protein and its corresponding abundance. From left to right, HNE concentrations that were used for the in vitro exposure experiments of the mitochondrial protein samples. The color in each cell represents protein abundance obtained from the “Hi3” peptide intensity approach: red is more abundant and dark green is less abundant. Black indicates missing values.

