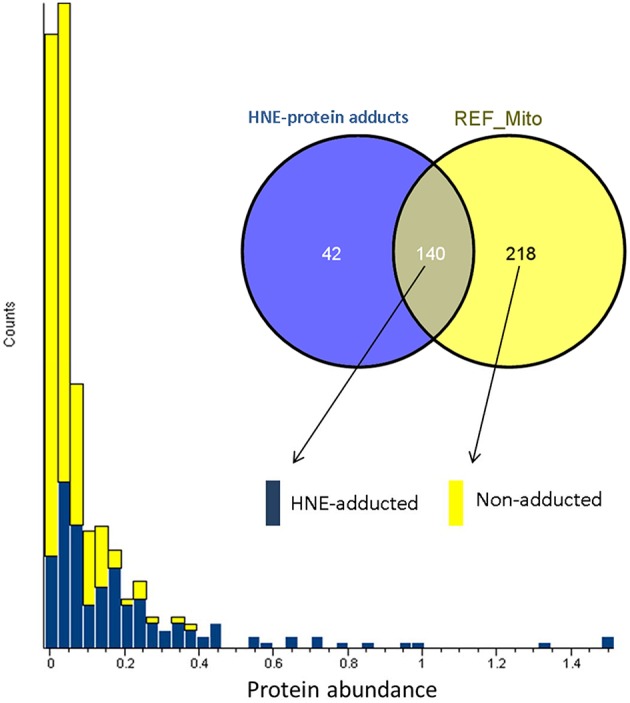
Figure 5.

Abundance distribution of HNE-adducted proteins and non-adducted proteins obtained by profiling the current liver mitochondrial protein preparations. Protein abundance was obtained from quantifying the “reference” mitochondrial proteome (REF_Mito) that was not exposed to HNE and no enrichment was performed. The yellow bars represent the 218 proteins that were present in the reference proteome. The blue bars show the proteins that were quantified after enrichment and were also identified in the reference proteome (see Materials and Methods section).
