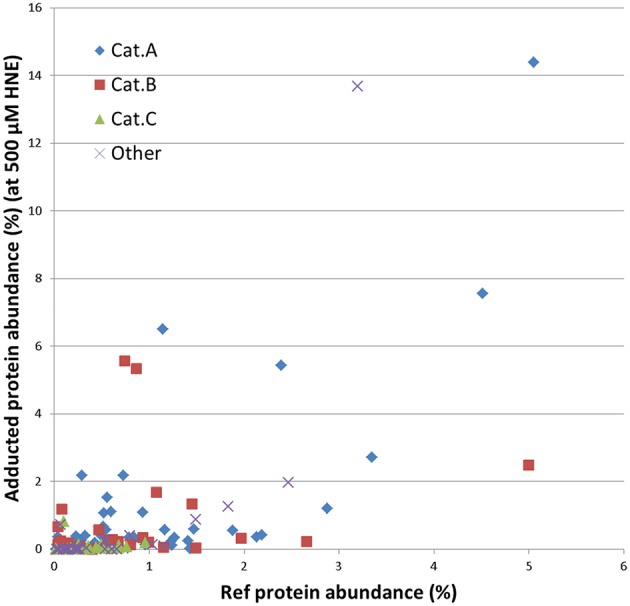
Figure 7.

Correlation of the abundance of the enriched proteins found in the 500 μM HNE exposure experiment with their respective abundance in the reference proteome. Proteins are marked according to their experimentally observed reactivity toward HNE: Cat A, -highly reactive-; Cat B, -medium reactive-; Cat C, -low reactivity- and other (observed reactivity does not conform to the patterns used for classification; see also Figures 5, 6). This presentation allowed us to cautiously conclude that adduct accumulation seemed to be slightly correlated to the abundance of the respective protein present in the reference proteome. However, Cat A proteins were relatively more abundantly detected in the datasets after enrichment as one would expect from their observed abundance in the reference proteome.
