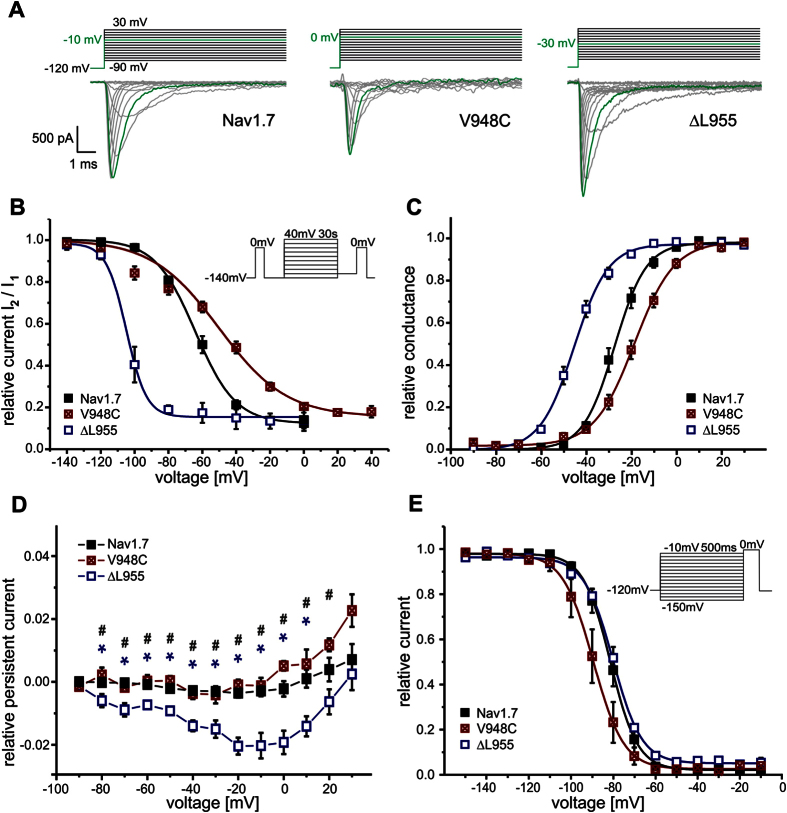
Figure 1. Electrophysiological properties of Nav 1.7 WT and the Nav 1.7/V948C and IEM-linked Nav 1.7/ΔL955 mutant.
(A) Representative current traces evoked by the indicated voltage protocol in transfected HEK293 cells. For each channel the potential resulting in maximal inward current is colored green. (B) Voltage-dependence of steady-state SI shows a −41.9 mV shift of V1/2 for Nav1.7/ΔL955 (blue squares, n = 6) to more hyperpolarized potentials and a 16.2 mV shift for Nav1.7/V948C (crossed red squares, n = 6) to more depolarized potentials compared to WT (filled black squares, V1/2 = −63.5 ± 2.1 mV, n = 10). (C) Normalized conductance–voltage relationships show a −17.7 mV shift of V1/2 for Nav1.7/ΔL955 (blue squares, n = 7) to more hyperpolarized potentials and a +8.1 mV shift of V1/2 for Nav1.7/V948C (crossed red squares, n = 7) to more depolarized potentials compared to WT (filled black squares, V1/2 = −26.8 ± 1.6 mV, n = 6). (D) The IEM mutant Nav1.7/ΔL955 shows increased relative persistent currents (n = 14, blue squares) compared to Nav1.7/V948C (crossed red squares, n = 10) and Nav1.7 WT (filled black squares, n = 19). Data shown in (D) were recorded in the presence of β4-peptide and 50 nM ATX-II and were significantly different for WT and Nav1.7/ΔL955 (blue*), and for Nav1.7/ΔL955 and Nav1.7/V948C (black#), p < 0.05. (E) V1/2 of steady-state fast inactivation is not altered by Nav1.7/ΔL955 (blue squares, n = 7) whereas Nav1.7/V948C (crossed red squares, n = 7) shifts V1/2 by −7.8 mV to more hyperpolarized potentials compared to WT (filled black squares, V1/2 = −81.4 ± 1.9 mV, n = 6).

