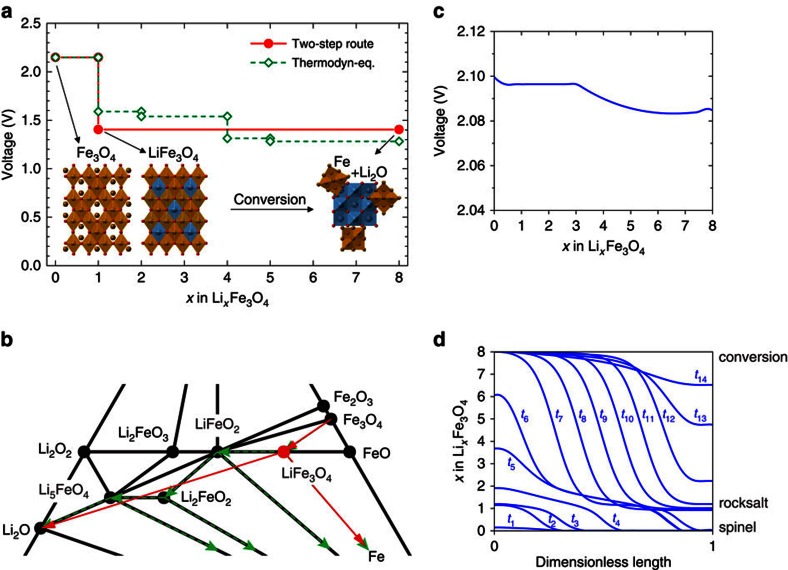
Figure 5. DFT calculation and phase-field simulation of lithiation process in Fe3O4 crystals.
(a) The voltage profiles as a function of Li composition (x=0–8) calculated by DFT showing both thermodynamic equilibrium (green dashed lines) and two-step reaction (red solid lines) routes for an entire lithiation process. The inset models showing crystal structures of Fe3O4 and LiFe3O4 phases during the intercalation process and a schematic of Li2O plus metallic Fe after the complete conversion reaction. Colour spheres representing Fe (yellow), Li (blue) and O (red). (b) Li–Fe–O phase diagram with overlaid arrow lines showing lithiation pathways through thermodynamic equilibrium multistep route (green dashed lines) or experimentally observed two-step route (red solid lines). (c) Discharge voltage profiles calculated from the phase-field modelling. (d) Li composition profiles along one-dimensional length as a function of reaction time simulated by the phase-field theory (also see Supplementary Movie 3). The time intervals are uniform between adjacent time stamps.

