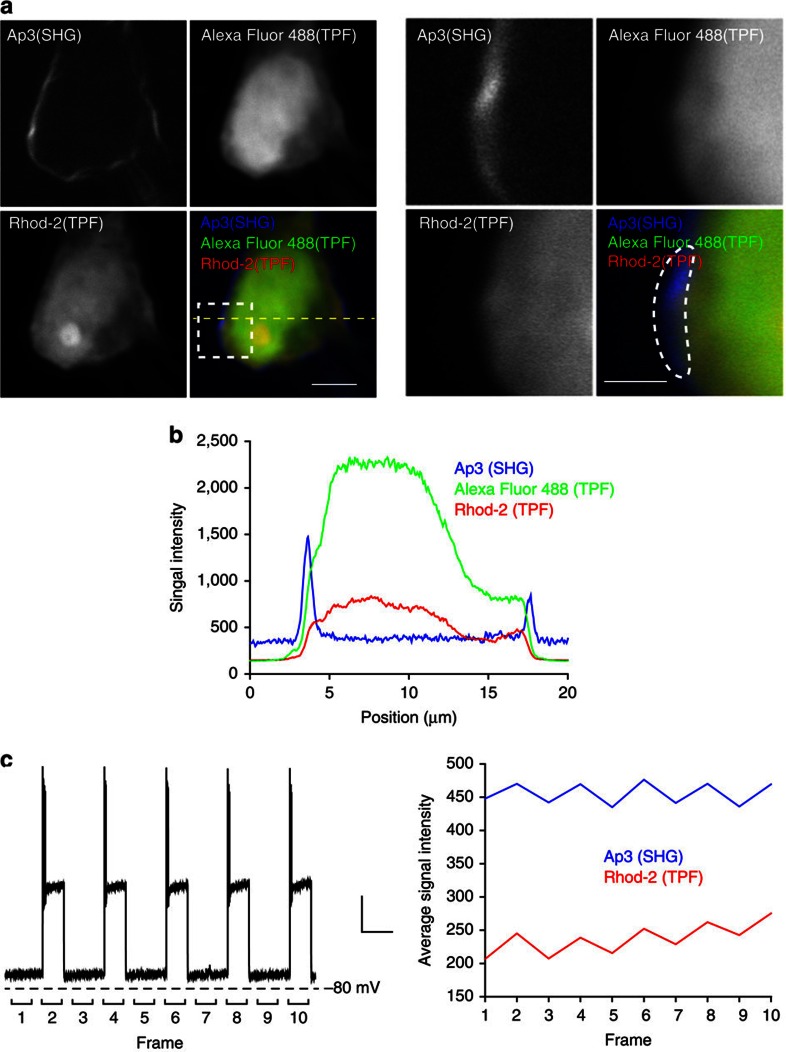
Figure 5. Multimodal two-photon imaging of membrane potential and intracellular calcium dynamics in cortical neurons.
(a) Representative images of Ap3, Alexa Fluor 488 and Rhod-2 at the soma of a patch-clamped neuron. SHG signals from Ap3 were simultaneously obtained with two-photon fluorescence signals of freely diffusible Alexa Fluor 488 dye, as well as the calcium indicator Rhod-2. Membrane proximal region in dotted square (left) is enlarged in (right). Scale bars, 5 μm (left) and 2 μm (right). (b) Intensity profiles of Ap3-SHG (blue), Alexa Fluor 488-TPF (green) and Rhod-2-TPF (red) at the line indicated by the yellow dotted line in a, left. (c) Simultaneous imaging of membrane potential and calcium concentration at the membrane proximity region indicated in the white dotted region in a, right. Frame scan was performed at 0.2 Hz with current injection in even-numbered frames that evoke depolarization (left). Scale bars, 20 mV and 5 s. Quantification of simultaneously obtained Ap3-SHG (blue) and Rhod-2-TPF (red) signals show membrane potential and intracellular calcium concentration changes near the membrane (right).

