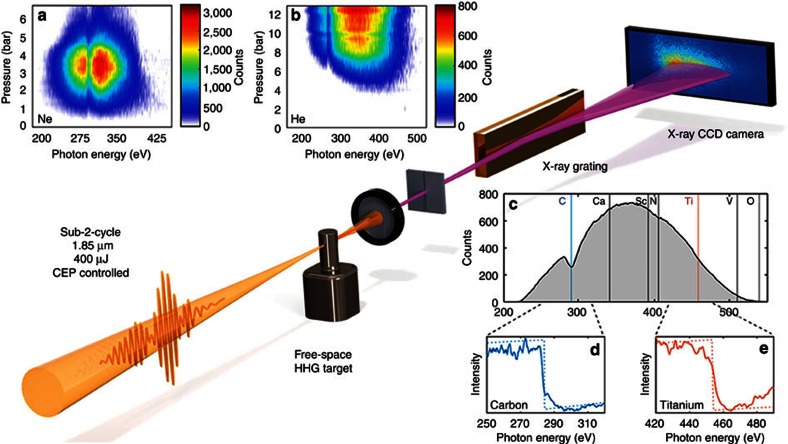
Figure 1. Experimental setup showing pressure dependence and spectral coverage.
Top: pressure scans in Ne (a) and He (b). Clearly visible is the C K-shell absorption edge due to hydrocarbon residue in the beamline. Middle: experimental setup consisting of a high-pressure effusive target, a free-standing IR filter, and the home-built spectrograph that consists of a 2,400 lines per mm gold coated grating and a cooled X-ray CCD. Bottom right: (c) a spectrum from HHG in He (2 min integration time) with the reachable K-shell absorption edges indicated by solid vertical lines and L-shell absorption edges indicated by dashed vertical lines. The two graphs below show absorption measurements using foils of 200 nm of carbon (d) and titanium (e) where the K-edge at 284 eV and L2,3-edges at 456 eV, are clearly evident.

