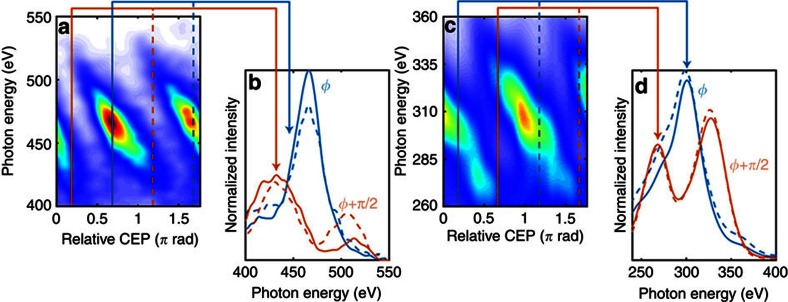
Figure 2. CEP controlled soft X-ray emission and its spectral influence.
Shown in a,c are spectra generated from helium (6 bar) and neon (3.5 bar), respectively, which were acquired for varying CEP in steps of 90 mrad and with 30 s integration time each. The solid lines in b,d show the dramatic change of the spectral amplitude for two different CEP values; these values are indicated by the coloured vertical lines in a,c. The excellent CEP stability of the system results in clearly resolved spectra which repeat—as expected—with π rad periodicity. This is shown by the dashed lines which are acquired for a π rad CEP offset compared with the matching solid coloured lines—see b,d.

