
Figure 6. Principal Coordinate Analysis (PCoA) plot of blood microbiomes of a selected subset of chickens.
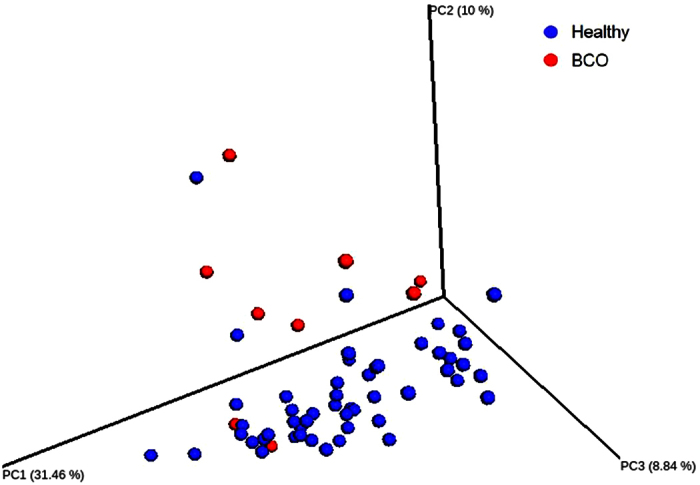
PCoA plot of healthy (n = 51) vs BCO (n = 9) chickens using weighted UniFrac metric at even sampling depth of 400 read per sample.
Official websites use .gov
A
.gov website belongs to an official
government organization in the United States.
Secure .gov websites use HTTPS
A lock (
) or https:// means you've safely
connected to the .gov website. Share sensitive
information only on official, secure websites.
PCoA plot of healthy (n = 51) vs BCO (n = 9) chickens using weighted UniFrac metric at even sampling depth of 400 read per sample.