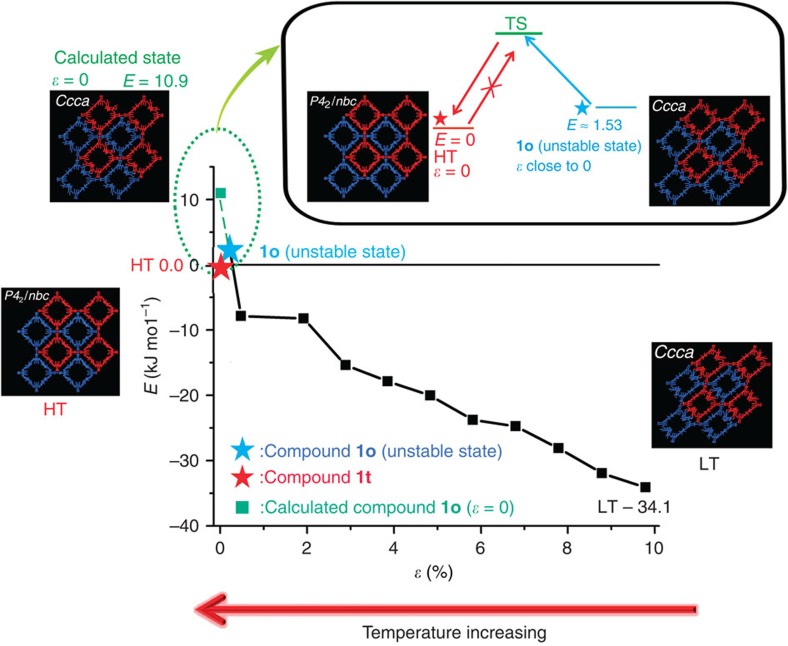
Figure 5. Calculated energy profile.
Calculated energy profile for compound 1o as a function of strain ɛ (inset: energy diagram for the thermally irreversible transition from compound 1o to compound 1t). The energy for compound 1t is set to be 0. The structural figures represent optimized structures (by calculation), and the ɛ value for compound 1o (that is, the unstable state) in the figure is set to be 0.1%; red and blue frameworks represent the pair of sextuple interlocked frameworks with opposite handedness. At lower temperatures, compound 1o is energetically preferred and exists with a large ɛ value. As the temperature increases, the ɛ value decreases and the potential energy increases. When ɛ approaches 0, compound 1t is energetically preferred and compound 1o transitions to compound 1t. The reverse transition (that is, from compound 1t to compound 1o) requires the initial activation of a symmetry-breaking process that involves overcoming an energy barrier. However, upon cooling, no heat can be gained to overcome such an energy barrier; therefore, the transition from compound 1t to compound 1o cannot occur upon cooling, resulting in stabilization of metastable compound 1t at lower temperatures. LT, HT and TS represent low-temperature phase, high-temperature phase and transition state, respectively.

