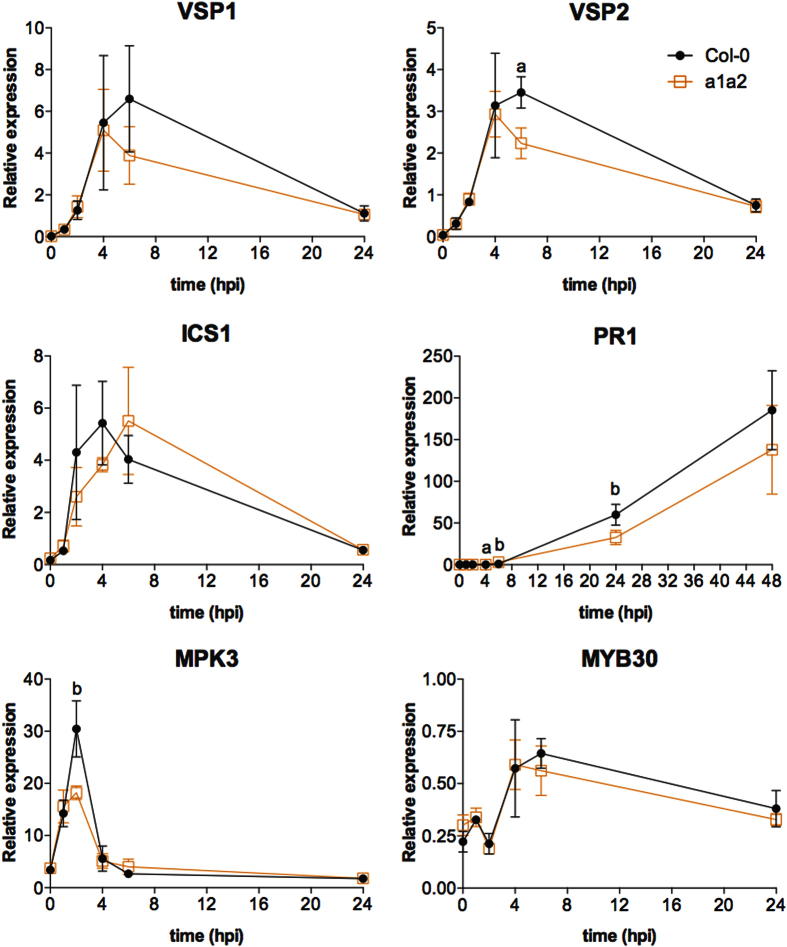
Figure 6. Response of selected genes to Pst AvrRpm1 in ate1 ate2 and wild-type plants.
The expression of JA (VSP1 and VSP2) and SA (ICS1 and PR1) response genes, as well as of known regulators of the response to Pst AvrRpm1 (MPK3 and MYB30), were monitored using RT-qPCR following inoculation of wild type (Col-0) and ate1 ate2 (a1a2) plants with Pst AvrRpm1 at a density of 5 × 10⁷ cfu/mL. Expression levels relative to those of the ‘REF1’ reference gene are presented (see Supplementary Table 3 for details). Error bars indicate SEM of four independent experiments. The results of Student’s t-tests are shown with ‘a’ indicating P-values < 0.05 and ‘b’ P-values between 0.05 and 0.1.

