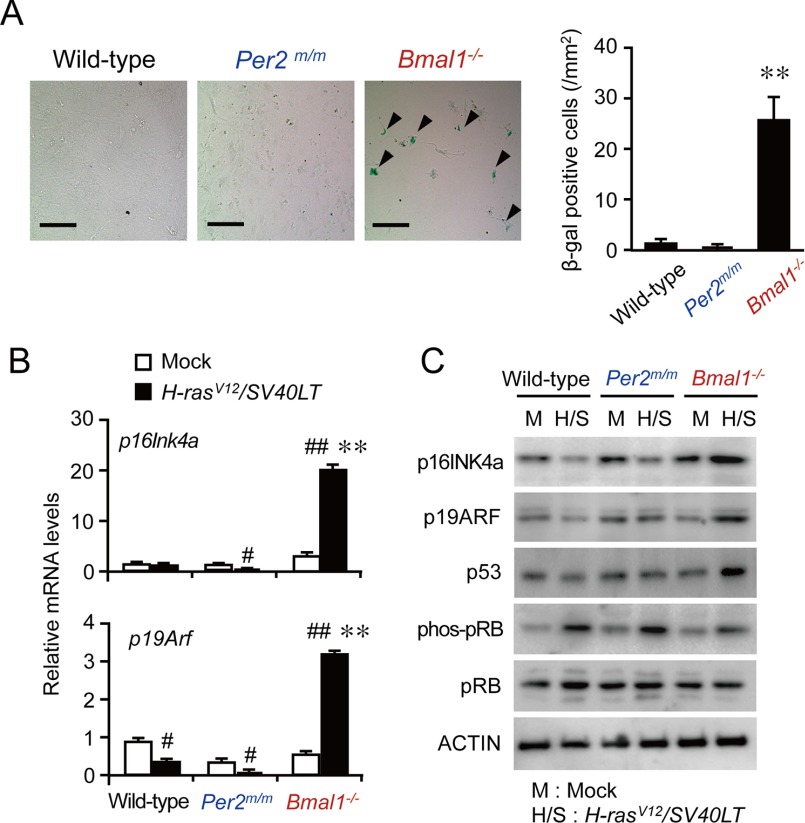
FIGURE 2.
Induction of cellular senescence in oncogene-introduced Bmal1−/− cells. A, β-gal staining of wild-type, Per2m/m, or Bmal1−/− cells infected with H-rasV12 and SV40LT. Arrows in the microscopic photograph indicate β-gal-positive cells. The scale bars indicate 50 μm. Values are the means ± S.E. (n = 3). **, p < 0.01 significantly different from other oncogene-introduced cells. B, the mRNA levels of p16Ink4a and p19Arf in wild-type, Per2m/m, or Bmal1−/− cells infected with oncogenes. Values are the means ± S.E. (n = 3). ##, p < 0.01 significantly different from mock-transfected group. **, p < 0.01 significantly different from other oncogene-introduced cells. C, the protein abundance of p16INK4a, p19ARF, p53, phosphorylated pRB (phos-pRB), and pRB in wild-type, Per2m/m, or Bmal1−/− cells infected with oncogenes.

