FIGURE 7.
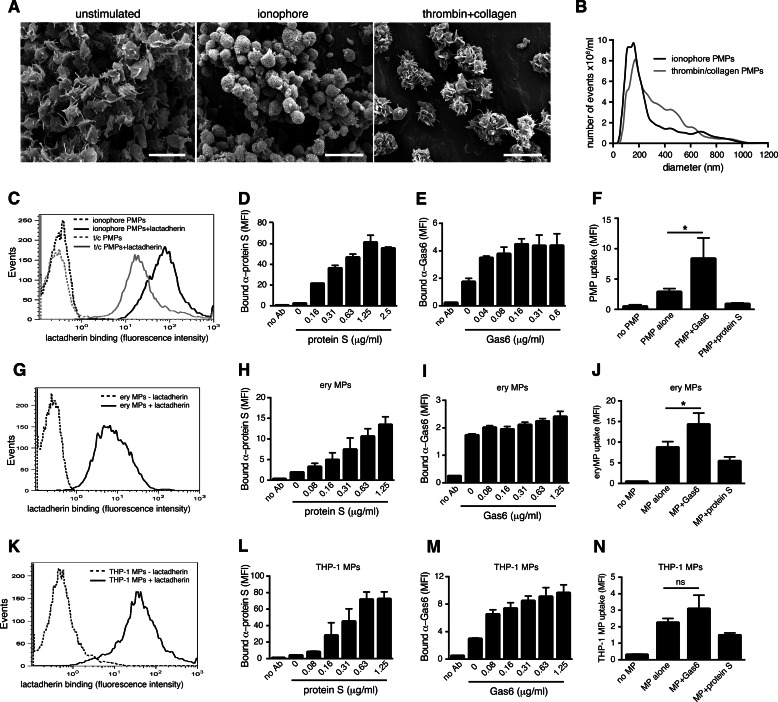
PMPs generated with thrombin and collagen are ingested equally well as ionophore-generated PMPs. The appearance of platelets stimulated with thrombin/collagen was visualized with scanning electron microscopy, showing a more typical platelet activation phenotype compared with ionophore-stimulated platelets (A). Scale bars denote 5 μm. The size of thrombin/collagen PMPs was compared with that of ionophore PMPs by nanotracking analysis and showed a more heterogeneous size distribution (B). The amount of PS exposure on the different PMPs was measured by evaluating lactadherin binding by flow cytometry (C). Binding of protein S (D) and Gas6 (E) to thrombin/collagen PMPs was evaluated by flow cytometry. The uptake of fluorescent thrombin/collagen PMPs into HAECs was measured in the presence of Gas6 and protein S using flow cytometry (F). Erythrocyte MPs were measured for their ability to bind lactadherin (G), protein S (H), and Gas6 (I). The influence of Gas6 and protein S on the uptake of fluorescent erythrocyte MPs in HAECs was measured by flow cytometry (J). Lactadherin (K), protein S (L), and Gas6 (M) binding to THP-1 MPs generated by LPS stimulation was measured using flow cytometry. The ability of Gas6 and protein S to modulate the uptake of fluorescent THP-1 MPs in HAECs was measured as above (N). Data show the mean and S.D. of at least three separate experiments, except for histograms, which are representative for three experiments. ns, not significant; *, p < 0.05. MFI, mean fluorescent intensity.

