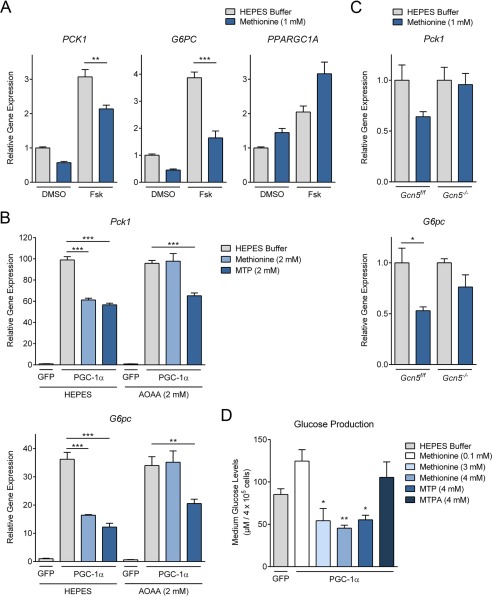
FIGURE 5.
Methionine repressed gluconeogenesis in primary hepatocytes. A, real-time PCR analysis of gluconeogenic gene expression upon methionine treatment in human liver carcinoma cells (n = 3). HepG2 cells were treated with DMSO or 30 μm forskolin (Fsk) overnight. HEPES buffer or methionine (1 mm) was added to the cells 3 h before harvesting. cDNA was generated from RNA, extracted using TRIzol-chloroform extraction methods. B, real-time PCR analysis of gluconeogenic gene expression upon the addition of methionine and MTP combined with AOAA treatment in primary hepatocytes (n = 3). Primary hepatocytes were infected with either GFP or FLAG-PGC-1α adenovirus. Two days post-infection, cells were incubated in DMEM maintenance medium lacking methionine for 7.5 h before harvesting. AOAA (0.2 mm) was added 4.5 h before harvesting. Methionine and MTP (2 mm) were added 4 h before harvesting. C, real-time PCR analysis of gluconeogenic gene expression upon the addition of methionine in Gcn5f/f and Gcn5−/− primary hepatocytes (n = 3). Primary hepatocytes were isolated from liver-specific Gcn5f/f and Gcn5−/− mice. Primary hepatocytes were infected with either GFP or FLAG-PGC-1α adenovirus. Two days post-infection, cells were incubated in DMEM maintenance medium lacking methionine for 7 h before harvesting. Methionine (1 mm) was added 4 h before harvesting. D, hepatic glucose production assay (n = 3). Primary hepatocytes were infected with either GFP or FLAG-PGC-1α adenovirus. Two days post-infection, glucose production capacity of primary hepatocytes was measured by incubating the cells in glucose free medium for 3 h. Methionine (0.1, 3, 4 mm), MTP (4 mm), and methylthiopropylamine (MTPA; 4 mm) were added to the cells 3 h before collection of the media samples. The glucose concentration was calculated based on the difference between pyruvate/lactate-free medium and 2 mm pyruvate/20 mm lactate-containing medium. For all multiple comparisons, one-way analysis of variance with post-hoc Tukey's test was used. *, p < 0.05; **, p < 0.01; ***, p < 0.001.

