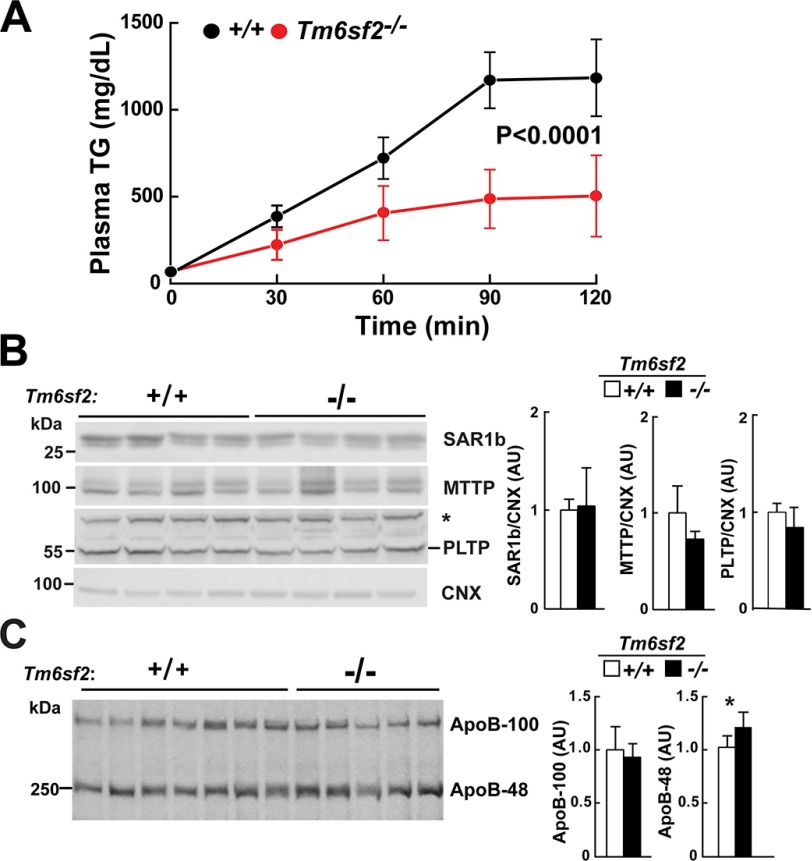
FIGURE 11.
VLDL secretion in WT and Tm6sf2−/− mice. A, VLDL-TG secretion. Triton WR-1339 (500 μg/g) was injected into the tail veins of chow-fed female mice (n = 4 mice/group, 9 weeks old) after 4-h fasting. Blood was collected at the indicated time points, and plasma TG levels were measured. Mean TG levels at each point are shown. Rates of VLDL-TG secretion were determined by least squares regression of plasma TG levels plotted against time. Slope estimates were determined from the linear portion of each graph and compared using Student's t test. B, immunoblotting analysis of SAR1b (secretion-associated, Ras-related GTPase 1B), microsomal TG transfer protein (MTTP), and phospholipid transfer protein (PLTP). Liver lysates (40 μg) were size-fractionated by 10% SDS-PAGE and then incubated with primary and secondary antibodies, as described under “Experimental Procedures.” *, nonspecific band. C, [35S]methionine incorporation in apoB. Male mice (n = 5, age = 9 weeks) were synchronized on a 3-day regimen of fasting (8:00 a.m. to 8:00 p.m.) and refeeding (8:00 p.m. to 8:00 a.m.). At 8:00 a.m. on day 4, food was withdrawn, and mice were fasted for 4 h and then injected via the tail vein with 200 μCi of [35S]methionine (1,175 Ci/mmol) and Triton WR-1339 (500 mg/kg). Blood was collected from the tail vein before and 45 and 90 min after the injection. Plasma samples from the 90 min point were treated with deoxycholate/trichloroacetic acid to precipitate proteins. The pellets were washed with acetone and dissolved in 200 μl of 2% SDS, 1 m urea buffer. Loading buffer (50 μl of 5× Western blot loading buffer) was added, and 20-μl aliquots were size-fractionated by 5% SDS-PAGE. Gels were dried and exposed to x-ray film (BIOMAX XAR) for 4 days at −80°C. Band intensity was quantified using the LI-COR Image Studio software. The experiment was repeated, and the results were similar. *, p < 0.05. AU, arbitrary units.

